Introduction
The Jordan Downs housing development in Watts was built for factory workers during World War II, converted to low-income housing in the 1950s, and left to deteriorate for decades in one of the most disinvested neighborhoods in Los Angeles (Welk, 2020). Extreme heat, the deadliest climate hazard in the United States (Narayanan & Keellings, 2025), compounds in neighborhoods shaped by this kind of disinvestment, where minimal tree canopy and aging housing without cooling is common. In 2019, California’s Strategic Growth Council awarded a Transformative Climate Communities grant to the Watts Rising Collaborative, more than 40 organizations managed by the Housing Authority of the City of Los Angeles (HACLA, 2026). By December 2025, more than 3,000 trees had been planted, solar panels had been installed on 53 homes, and the $33.25 million TCC grant attracted over $100 million in additional funding (HACLA, 2026). In 2024, SGC published the Multi-Benefit Projects Catalyst Model as a toolkit for other funders to replicate Watts Rising, with the hypothesis: “empowering communities to design multi-benefit projects creates a variety of positive outcomes” (SGC, 2026).
This paper asks if the Catalyst Model shapes the design and evaluation of extreme heat investments in frontline communities, using descriptive analysis of co-benefit rates across five California programs and evaluating each program’s design against the five elements of the Catalyst Model. Programs designed around the model produce different intervention compositions as well as higher bundling volumes, and program architecture, not lead organization type, drives variation in project composition. The evaluation infrastructure, however, cannot verify whether bundling increases community capacity to respond to climate hazards; measuring interaction effects will require methods drawn from other fields.
Heat Vulnerability as Structural Disinvestment
Urban heat exposure in the United States is a product of racialized land use policy. Postwar suburbanization enabled white residents to leave industrial cores through federally subsidized development (FHA loans, the GI Bill, highway construction) while communities of color were confined through restrictive covenants, redlining, and racial zoning (Pulido, 2000; Pulido, 2018). The neighborhoods that lost residents also lost tree canopy and green space and gained impervious surface cover; the racialization of postwar suburbanization produced a corresponding racialization of thermal exposure in the urban cores left behind (Mitchell & Chakraborty, 2015).
Formerly redlined neighborhoods today average 4.7°F higher land surface temperatures than non-redlined areas, and non-Hispanic Black residents are 52% more likely to live in areas with absent tree canopy and high impervious surface (Hoffman et al., 2020; Jesdale et al., 2013). Aging housing stock and insufficient insulation compound the exposure by producing higher indoor temperatures even when outdoor conditions are comparable across neighborhoods (Benz & Burney, 2021). Extreme heat events intensify these disparities; simultaneous exposure to heat and air pollution alone increases mortality by 21% (Rahman et al., 2022). Heat research has produced precise tools for quantifying these disparities, from surface temperature mapping to building-level energy demand modeling (Akbari & Kolokotsa, 2016; Wu et al., 2025).
The harms of heat, however, compound across systems beyond what single indicators capture. Thermal insecurity, defined as the inability to maintain safe indoor temperatures, is produced by the intersection of inadequate insulation, unaffordable cooling costs, landlord neglect, and absent cooling infrastructure; residents experience these failures simultaneously, and the vulnerability is produced by their compounding, not by any single exposure in isolation (Hamstead, 2023). Energy poverty exacerbates thermal insecurity; households that spend disproportionately on cooling forgo food, medical care, and other necessities, turning heat survival into economic and health crises (Sun et al., 2025; Ashbaugh & Kittner, 2024). Heat vulnerability is produced by the interaction of these failures, not by their sum; evaluating success in overcoming structural inequity requires measuring the outcomes of interactive systems, not the stated goals of individual policies (powell, 2010).
Co-Benefits and Synergies Measurement Gap
“Co-benefits” are defined as additional positive effects of a climate intervention beyond its primary objective; for example, a green roof installed for stormwater management also reduces ambient temperatures. “Synergies” occur when combined interventions produce benefits that exceed what each would deliver separately, as when green roofs and street trees together generate greater cooling than the sum of their independent effects (Sharifi, 2021). Co-benefits can be measured by documenting the multiple outcomes of a single intervention, while synergies require measuring whether combined interventions interact to produce something beyond the sum of their individual effects; in theory, a measurement of synergies could measure whether the root causes of heat vulnerability are being addressed and not just the symptoms.
Individual co-benefits have been extensively researched and documented at the project level (Zusman et al., 2025). In green infrastructure research, “multifunctionality” analysis counts co-occurring benefits such as carbon storage and erosion control per intervention and has demonstrated a roughly 3:1 return when multiple benefits are summed (González-García et al., 2023). No existing framework measures co-benefits at the city scale (Floater et al., 2016); C40’s Urban Climate Action Impacts Framework maps individual actions to their impacts but does not provide methods to measure if multiple projects implemented in the same neighborhood produce different outcomes (C40 & Ramboll, 2022). In practice, cities list co-benefits without measuring them; two-thirds of health co-benefit references in C40 member cities’ climate action plans did not identify measurable outcomes (Johnson et al., 2022). Existing methods for measuring environmental justice are dominated by distributive and quantitative approaches; recognitional and procedural justice dimensions are underrepresented, and no broadly adopted methodology evaluates environmental justice across multiple dimensions simultaneously (Loos et al., 2025).
Moving from co-benefit counting to synergy measurement is undeveloped. Technical synergies between stormwater management and urban heat island mitigation are identifiable at the intervention level, but measurable only qualitatively (He et al., 2019). Evidence for synergies more broadly remains case-specific (Sharifi, 2021), and whether combined interventions interact to produce synergies remains poorly understood even where individual co-benefits are well documented (Herath & Bai, 2024). The synergy measurement gap is an unresolved problem in the field, not an oversight specific to any single program or funder. The conceptual tools for distinguishing additive co-benefits from multiplicative synergies exist, but the empirical methods for testing that distinction at the scale of public investment programs do not. This paper evaluates whether SGC’s Multi-Benefit Projects Catalyst Model provides methods to detect synergies between bundled interventions rather than just co-benefits.
California Strategic Growth Council
Assembly Bill 2722 established the Transformative Climate Communities (TCC) program to fund “neighborhood-level transformative climate community plans that include multiple, coordinated greenhouse gas emissions reduction projects that provide local economic, environmental, and health benefits to disadvantaged communities” (Burke, 2016). California’s Strategic Growth Council (SGC), which administers TCC, distilled lessons from the program into a set of Catalyst Models intended for adoption by other government funders, launching the Catalyst Model Hub in 2022 (SGC, 2023a; SGC, 2024). SGC organizes its Catalyst Models into six frameworks (Table 1); this paper focuses on the Multi-Benefit Projects Model, which formalizes TCC’s theory that investments in frontline communities should bundle interventions across sectors, attract additional funding, and produce outcomes greater than what any single program would deliver alone (SGC, 2026; see Table 2).
Table 1. SGC’s six policy Catalyst Models
| Model | Description |
|---|---|
| Participatory Research to Policy | Map place-based vulnerabilities and priorities through community-based research |
| Community Readiness | Increase funding access and implementation in under-resourced communities through technical assistance and capacity building |
| Community-Driven Investment | Catalyze and sustain investment in under-resourced communities through power-sharing |
| Iterative and Inclusive Program Design | Respond to constituents’ changing needs in climate equity program design and implementation |
| Collaborative Governance | Create ongoing accountability to communities through formal community-level collaboratives |
| Multi-Benefit Projects | Design projects that bundle interventions across sectors to produce multiple positive outcomes |
Table 2. The five elements of the Multi-Benefit Projects Model
| Element | Description |
|---|---|
| 1. Identify potential benefits and beneficiaries | Programs identify benefits across a broad range of project types, including positive and negative outcomes, and assess equity implications of proposed investments. |
| 2. Provide communities flexibility to select and design projects that meet multiple integrated objectives | Communities design integrated, multi-benefit projects. In TCC, this takes the form of the Collaborative Stakeholder Authority (CSA), a governance structure that mandates CBO involvement in project design even when public agencies hold fiscal authority. |
| 3. Demonstrate how proposed projects further a neighborhood’s ability to meet specific program objectives | Applicants link individual projects to area-wide goals, connecting proposed work to broader program objectives. |
| 4. Leverage multi-sectoral funding to sustain delivery of benefits and long-term capacity | Programs attract state, federal, philanthropic, and private-sector funding to sustain benefit delivery and build long-term community capacity. |
| 5. Ongoing program evaluation, verification, and feedback to achieve outcomes | Programs evaluate whether funded projects achieve intended outcomes. TCC operationalizes this through a contract with UCLA’s Luskin Center for Innovation, which evaluates funded sites using per-project-type logic models (UCLA LCI, 2018). |
This analysis focuses on Elements 2 and 5: whether programs give communities flexibility to design multi-benefit projects, and whether evaluation can verify the outcomes.
Data & Methodology
This analysis draws on 373 grant awards made between 2015 and 2025 across five California state programs that fund climate interventions in frontline communities: the Affordable Housing and Sustainable Communities program (AHSC; 212 awards), the Transformative Climate Communities program (TCC; 43 awards), the Community Resilience Centers program (CRC; 30 awards), the Interagency Climate Adaptation and Resilience Program’s Extreme Heat and Community Resilience Program (ICARP EHCRP; 46 awards), and CalEPA Community Air Protection Action Grants (CalEPA Action Grants; 42 awards). Each program defines its own eligible applicants, scoring criteria, and required project components (Table 3).
Table 3. Program characteristics and relationship to the Catalyst Model
| Program (administering agency) | Legislation and funding | Relationship to Catalyst Model | CBO lead type |
|---|---|---|---|
| AHSC (SGC via HCD) | SB 862 (2014); Greenhouse Gas Reduction Fund (GGRF) | Predates the Catalyst Model; required by statute to demonstrate direct GHG reductions per SB 375, which constrains project design toward housing and transit. | Affordable housing developers (LIHTC expertise, construction financing) |
| TCC (SGC) | AB 2722 (2016); GGRF, General Fund, Prop 4 | The Catalyst Model was derived from TCC’s programmatic design. | Broad eligibility; Collaborative Stakeholder Structure requires public agency co-applicant |
| CRC (SGC) | AB 211 (2021); General Fund, Prop 4 | First awards predate the Multi-Benefit Projects model’s publication but share structural features with it, including mandated CBO governance. | Grassroots CBOs in collaborative governance roles |
| ICARP EHCRP (Governor’s Office of Land Use and Climate Innovation) | SB 155 (2021); Prop 4, GGRF, Aliso Canyon settlement | Not administered by SGC; not designed with reference to the Catalyst Model. | Broad eligibility, no specialization required |
| CalEPA Action Grants (CalEPA) | SB 170 (2021), SB 154 (2022); General Fund | Not administered by SGC; not designed with reference to the Catalyst Model. | Community-based nonprofits and tribal governments (501(c)(3) required) |
Award data were collected from publicly available grant awardee lists, program websites, and published reports for each of the five programs, downloaded between January and March 2026. Each award in the dataset was tagged with a lead organization type, simplified for analysis into three categories: CBO (community-based organization), public agency, and tribal. What “CBO” means in practice differs across programs (see Table 3); a CBO leading an AHSC award and a CBO leading a CalEPA Action Grant are different types of organizations operating under different programmatic constraints. Each award was then coded across nine intervention-type boolean variables (Table 4) by reviewing individual project awardee descriptions from the published reports.
Table 4. Intervention-type coding criteria
| Variable | Coded “yes” when the project description includes: |
|---|---|
| Urban greening | Tree canopy, cool pavement, shade structures, green infrastructure |
| Food systems and urban agriculture | Community gardens, food production, distribution networks, food sovereignty programming |
| Clean energy and resilient power | Solar, battery storage, microgrids, HVAC, electrification |
| Housing and shelter | Affordable housing, emergency shelter, unhoused services |
| Community safety and restorative justice | Restorative justice, violence prevention, reentry, decarceration, diversion |
| Tribal cultural stewardship | Cultural preservation, traditional ecological knowledge, indigenous land management |
| Health services and healing | Health clinics, mental health, healing justice, public health programming |
| Transit | Transit infrastructure, active transportation, transit-oriented development |
| Extreme heat mitigation | Any intervention addressing extreme heat, including cooling or cooling centers, energy during power shutoffs, and programming during heat waves |
The analysis addresses two research questions:
- A. Does program architecture or lead organization type produce more variation in the number and type of interventions per award?
- B. Can the model’s evaluation infrastructure (Element 5) verify the multi-benefit outcomes its design element (Element 2) is intended to generate?
To address (A), this paper uses descriptive statistics from the dataset: average intervention types per award by program, intervention profiles showing which types each program funds and at what rates, and comparisons of bundling by lead organization type within and across programs. To address (B), this paper compares published evaluation reports and program measures against what the Multi-Benefit Projects Model claims to produce. The dataset has limitations that bound the claims of this analysis: it captures project design, not outcomes; whether funded interventions produced their intended benefits, interacted with each other, or were experienced as beneficial by residents is beyond the scope of the data.
Findings
Program Architecture Produces More Co-Benefit Variation Than Lead Type
Average intervention types per award range from 1.02 (CalEPA Action Grants) to 3.87 (CRC) (Figure 1), while CBO-led and public-agency-led awards within the same program differ by no more than 0.22 intervention types outside of TCC (Table 5).
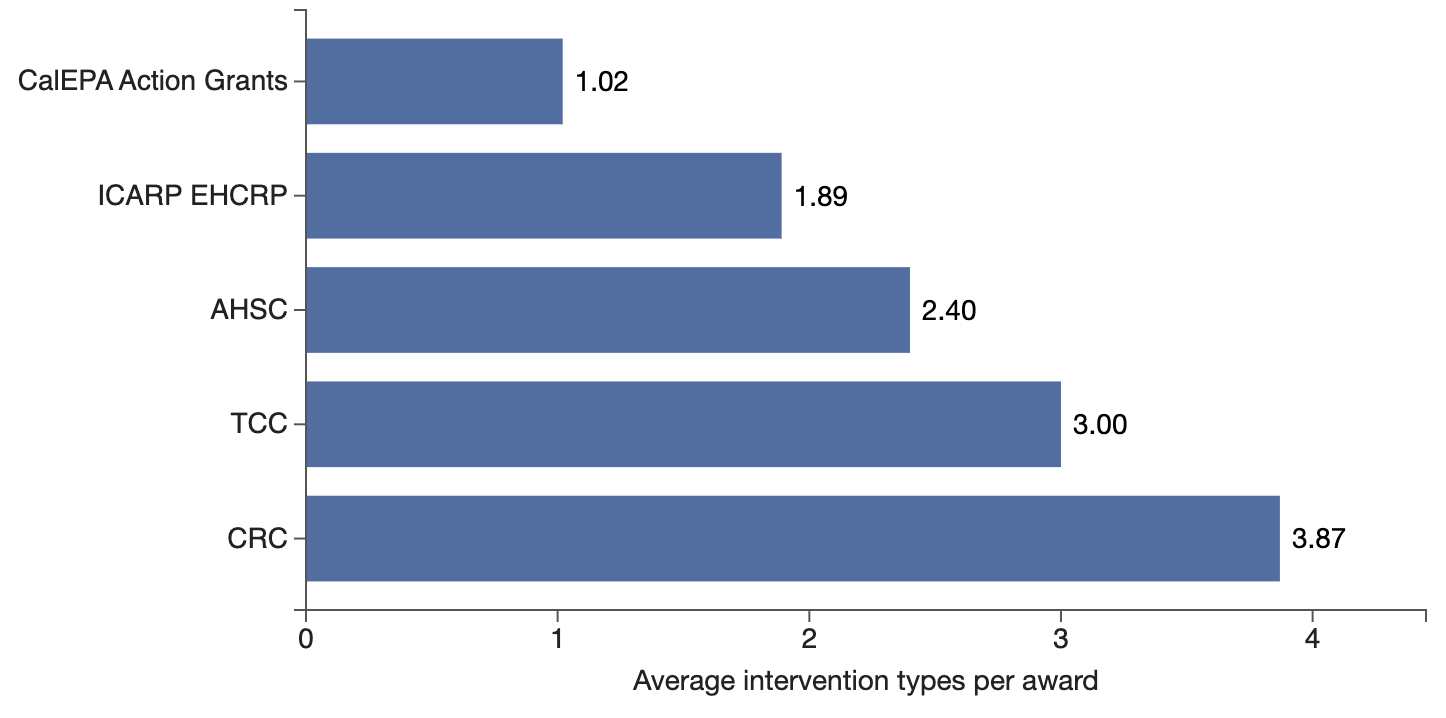
Figure 1. Average intervention types per award by program.
Table 5. Average intervention types per award by lead organization type and program
| Program | CBO | Public | Tribal | Overall |
|---|---|---|---|---|
| CRC | 3.84 (n=19) | 4.33 (n=6) | 3.40 (n=5) | 3.87 (n=30) |
| TCC | 4.00 (n=6) | 2.79 (n=34) | 3.33 (n=3) | 3.00 (n=43) |
| AHSC | 2.40 (n=144) | 2.39 (n=64) | 2.75 (n=4) | 2.40 (n=212) |
| ICARP EHCRP | 2.00 (n=23) | 1.78 (n=23) | — | 1.89 (n=46) |
| CalEPA Action Grants | 0.90 (n=31) | 1.36 (n=11) | — | 1.02 (n=42) |
| All programs | 2.31 (n=223) | 2.48 (n=127) | 2.30 (n=23) | 2.37 (n=373) |
Within-program differences by lead type are negligible (AHSC’s CBO-led and public-agency-led awards differ by 0.01 intervention types), and the overall averages by lead type converge (CBO 2.31, public 2.48, tribal 2.30) while program averages range from 1.02 to 3.87. TCC is an exception, where CBO-led awards average 4.00 intervention types versus 2.79 for public-agency-led, but with only 6 CBO-led awards, the difference may reflect the Collaborative Stakeholder Authority’s governance structure rather than a general CBO effect on bundling.
Programs Produce Different Intervention Compositions
Research question (A) on co-benefit variation patterns is also answered by analyzing the intervention types each program funds and the combinations they produce (Figure 2).
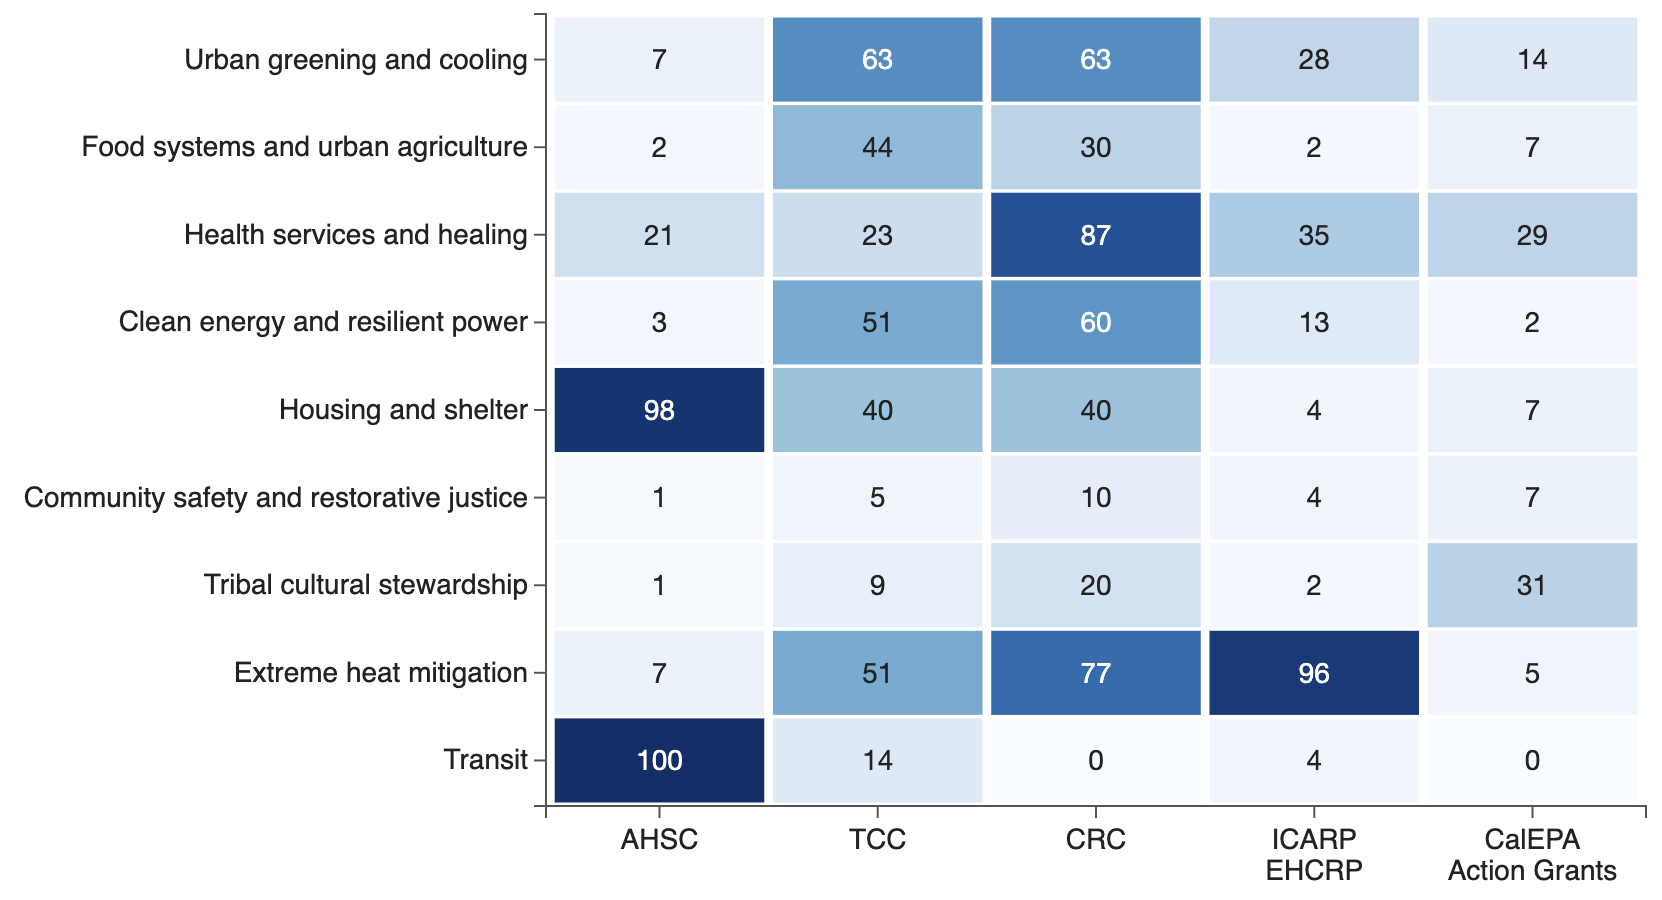
Figure 2. Intervention type rates by program (%).
AHSC is dominated by housing (98%) and transit (100%), with all other intervention types below 21%; its project composition reflects its origins in affordable housing and transit-oriented development policy. TCC spreads more evenly across greening (63%), energy (51%), extreme heat mitigation (51%), food systems (44%), and housing (40%). CRC has the broadest spread and the highest rates in health services and healing (87%), extreme heat mitigation (77%), greening (63%), and energy (60%). ICARP EHCRP’s programmatic mandate is for extreme heat mitigation infrastructure; as a result, 96% of awards include extreme heat mitigation, with health services (35%) and greening (28%) as secondary components. CalEPA Action Grants are the least bundled overall, with tribal cultural stewardship (31%) and health services (29%) as the most common intervention types.
The programs differ not only in how many intervention types they fund but in which combinations they produce. TCC and CRC both fund greening at 63%, but CRC pairs it with health services at nearly four times the rate of TCC (87% vs. 23%). The differences in composition correspond to differences in program design: eligible activities, scoring criteria, applicant qualifications, and required project components shape what applicants propose, which in turn shapes what gets funded. TCC and CRC, both administered by SGC with broad eligibility and cross-sector design flexibility, produce the highest average bundling and the broadest intervention spreads. ICARP EHCRP, CalEPA Action Grants, and AHSC produce narrower profiles concentrated around their specific programmatic mandates.
Evaluation Infrastructure Cannot Verify Multi-Benefit Outcomes
The TCC evaluation plan is organized around per-project-type logic models; each project type has its own chain of inputs, activities, outputs, outcomes, and impacts, and each site’s progress report lists outputs (trees planted, solar systems installed) and estimates outcomes per project type (averted VMT, energy cost savings, GHG reductions) (see Figure 3 for an example; UCLA LCI, 2018; Karpman et al., 2024; Astudillo et al., 2024). The evaluation plan acknowledges that there is no comprehensive list of outcomes and metrics for evaluating initiatives that build climate resilience (UCLA LCI, 2018). The per-project-type logic models can verify that individual project types delivered their intended outputs; they cannot verify whether bundling interventions across sectors produces outcomes beyond what each intervention would achieve independently.
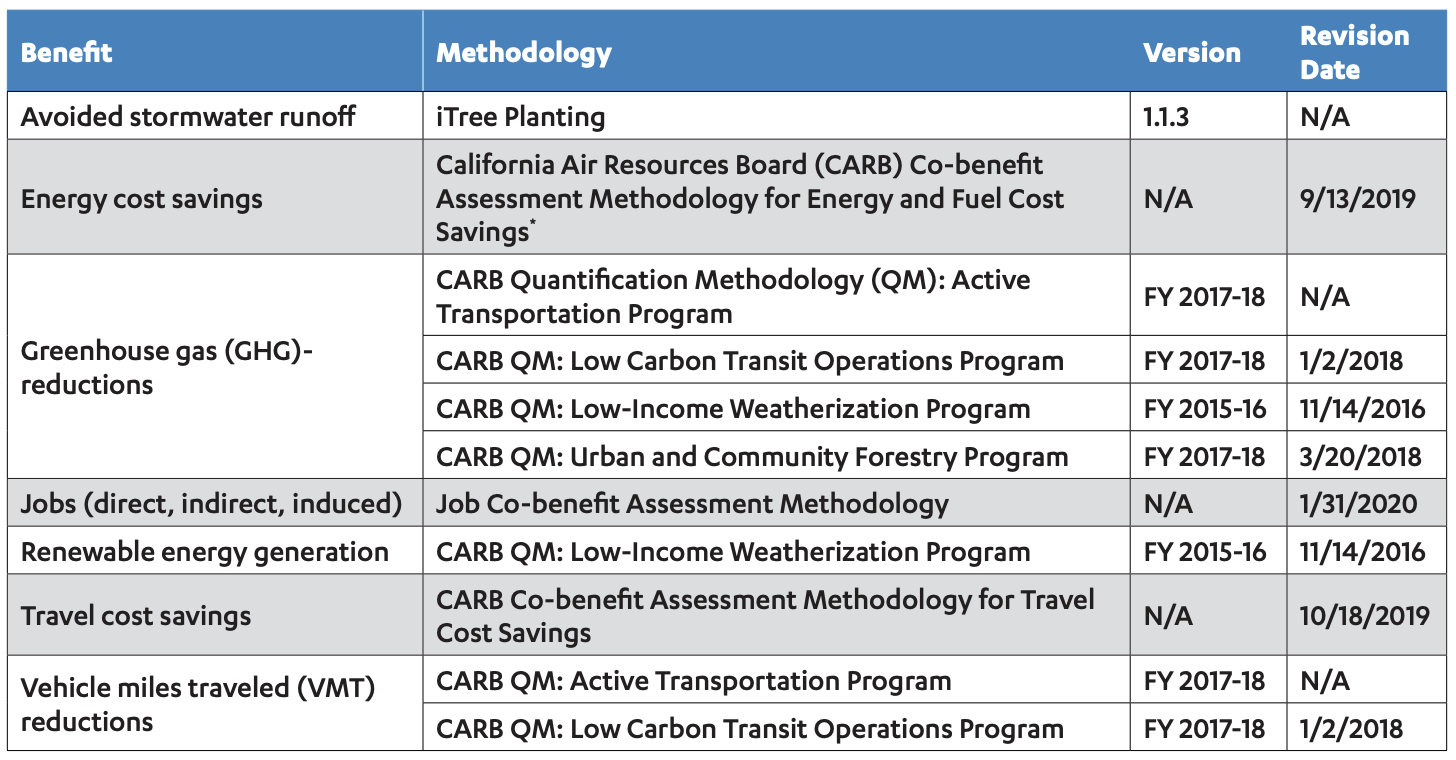
Figure 3. Anticipated benefits and estimation methods, Green Together TCC site. Note: methodologies labeled “co-benefit” from CARB measure non-GHG benefits of individual GHG-reduction investments (e.g. energy cost savings from a solar project, travel cost savings from a transit project); they do not measure benefits produced by the interaction of multiple investments. Source: Hernandez & Karpman (2025).
Financial leverage (Element 4) is measurable within TCC evaluation reports, comparing dollars to dollars: Transform Fresno attracted $117.3 million in outside funds toward a $66.5 million TCC grant; Ontario Together leveraged $28.9 million against a $33.25 million TCC grant (Karpman et al., 2024; Astudillo et al., 2024). Element 2 has no comparable metric; there is no ratio, indicator, or evaluation methodology in the current framework that answers the parallel question for multi-benefit design.
CRC’s evaluation framework is organized around three impact categories: climate resilience, community resilience, and impact on priority communities, but the example metrics provided are one-dimensional (facility usage counts, county of residence, purpose for attending) (SGC, 2026). No CRC award cohort has yet reached the evaluation phase or reported metrics, as the framework is new (SGC, 2025a). It does not assess whether the co-location of interventions within a single facility produces outcomes different from delivering each service independently.
Practitioner feedback at SGC’s inaugural Catalyst Conference corroborated these challenges, identifying the need for standardized metrics, raising concerns about community capacity for data collection, and flagging the tension between program accountability requirements and implementation realities (SGC, 2023a). The evaluation frameworks are still being iterated on; any metrics must be both feasible for community data collection and meaningfully connected to multi-benefit outcomes of the programs.
Discussion
Programs where the Catalyst Model is embedded produce more and more diverse co-benefit intervention types than programs outside it, and program architecture, not lead organization type, drives these differences. The co-benefit rate findings also complicate Element 2’s promise of community flexibility; if program architecture shapes project composition more than community-level decisions, this may imply that expert-defined frameworks are still constraining what communities can propose (Castán Broto & Westman, 2019) even in a bundled program framework. CRC’s collaborative governance structure, which produced the most intersectional compositions in the dataset, suggests that the distinction depends on how much design and knowledge authority programs share with communities (Killam & Kawachi, 2022; Wallerstein et al., 2022). Whether narrower programs like ICARP EHCRP produce less community capacity to respond to heat than broader ones like CRC is an open question.
A lack of co-benefit measures is not unique to SGC; no existing framework measures interactions between bundled interventions at scale, and the most recent wave of research still focuses on barriers to individual solutions rather than on how bundled programs interact (Floater et al., 2016; Herath & Bai, 2024). If other funders adopt the Catalyst Model, they will encounter this same structural limitation. The model is portable as a design tool but not yet as an accountability tool.
Methods from other fields suggest possible approaches to measuring interaction effects beyond summing the individual parts (González-García et al., 2023). If co-benefits restructure the strategic logic of collective action rather than simply adding to it (Brumme & Rübbelke, 2023), measuring each component’s marginal contribution to the bundle requires methods that evaluate the bundle as a system. The Shapley value from cooperative game theory measures whether a coalition’s value changes with and without a given component (Victor Babu et al., 2025); causal loop diagramming has made visible cross-domain feedback effects in bundled equity public health interventions that per-component logic models missed entirely (Headen et al., 2025). These methods remain technically demanding and have not been applied at the scale of state climate investment programs, but they point toward the kind of measurement infrastructure Element 5 could use to verify whether integration produces community capacity beyond the sum of individual interventions.
Conclusion
This analysis asked two questions about SGC’s Multi-Benefit Projects Catalyst Model: whether its effects are measurable by co-benefit rates across programs with similar goals, and whether the model’s evaluation infrastructure can verify the multi-benefit outcomes its design is intended to generate. Programs influenced by the Catalyst Model produce more intervention types per award and more diverse intervention compositions; program architecture, not lead organization type, defines these differences. The evaluation infrastructure, however, cannot verify whether bundling produces synergies beyond what each intervention would achieve independently.
Heat vulnerability is produced by racialized disinvestment and compounds across housing, energy, and health systems rather than accumulating within any single one. Measurement tools can quantify heat as a physical phenomenon with precision, but whether bundled investments address these root causes to change how communities experience heat vulnerability is a different question. Element 5’s evaluation infrastructure is not yet equipped to answer it, even within a program whose design principles were built to center community knowledge and governance. The Catalyst Model can demonstrate that bundling happens and that bundled projects attract additional investment, but until evaluation methods can measure interaction effects between bundled interventions this gap will persist for any funder that adopts the model.