Introduction
In 1973, Bay Area Rapid Transit (BART) built Richmond Station as its north terminus in West Contra Costa. Amtrak added a stop at the site in 1978.1 Richmond Station connects two BART lines, AC Transit and Golden Gate Transit buses, and Amtrak’s San Joaquins and Capitol Corridor service.2 It is bordered to the south by the Macdonald Avenue Downtown and centered on one of Richmond’s largest employment zones (Figure 1).3 Up until 2004, the 17-acre site had a station platform surrounded by surface parking.
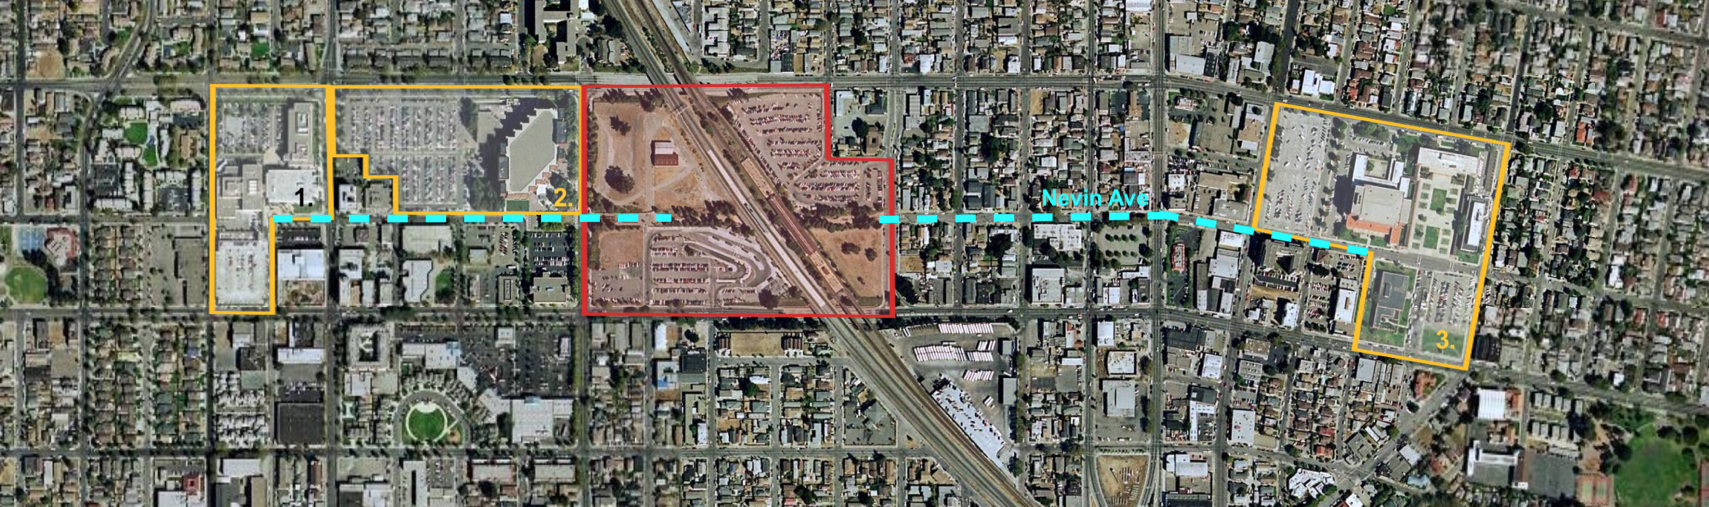
Figure 1. Richmond Station and major employers of Downtown Richmond (2002). Richmond Station is outlined in red; the station building is west of the tracks and runs below grade. Its largest employment neighbors are highlighted in yellow: 1. Kaiser Hospital, 2. Federal Social Security Payment facility, 3. Richmond Civic Center.
In the 1990s, BART began efforts to build Transit-Oriented Developments (TODs) around its stations, to “increase sustainable transit ridership [and] revitalize communities.”4 In April 1999, BART and the Richmond City Council agreed on a mixed-use project at Richmond Station called the Richmond Transit Village.5 The scope included 231 housing units, 27,000 square feet of retail, a new transit station, a five-story parking garage, and the promise of future housing.6 This case study analyzes the costs and benefits of the project; ultimately, the Richmond Transit Village alone will not achieve its goals without supportive state and regional policy.
Phases
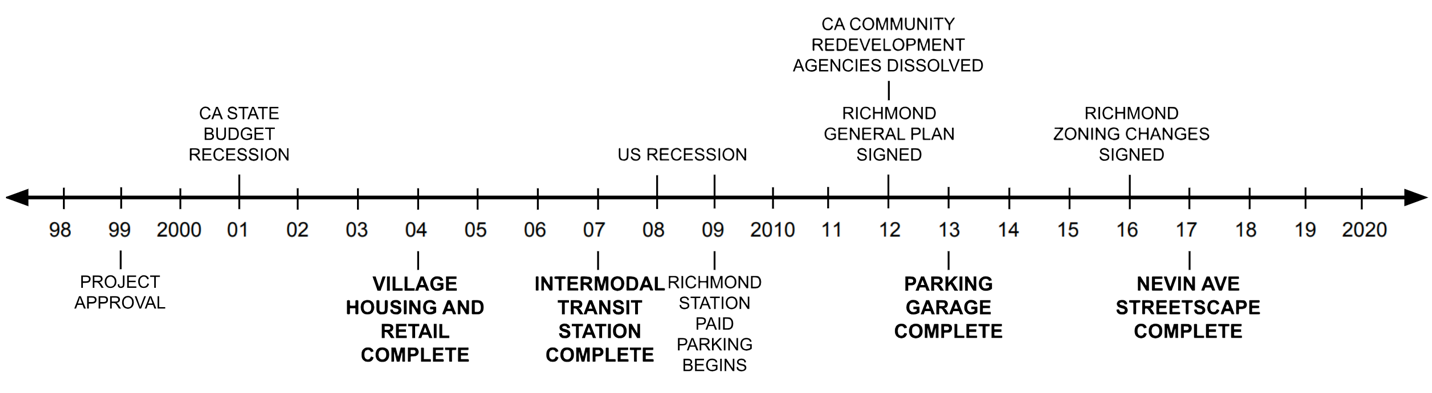
Figure 2. Timeline of project phases and external events. The project had four phases completed with numerous delays and funding setbacks; the vision set in the late 1990s is still in progress in 2024.
The project had four phases completed with numerous delays and funding setbacks. The vision set in the late 1990s is still in progress in 2024.
The first phase of the Transit Village was completed in 2004. Phase 1 built 132 townhouses (66 of them affordable) with their own garages, a new outdoor plaza and park, and 7,000 square feet of retail.7
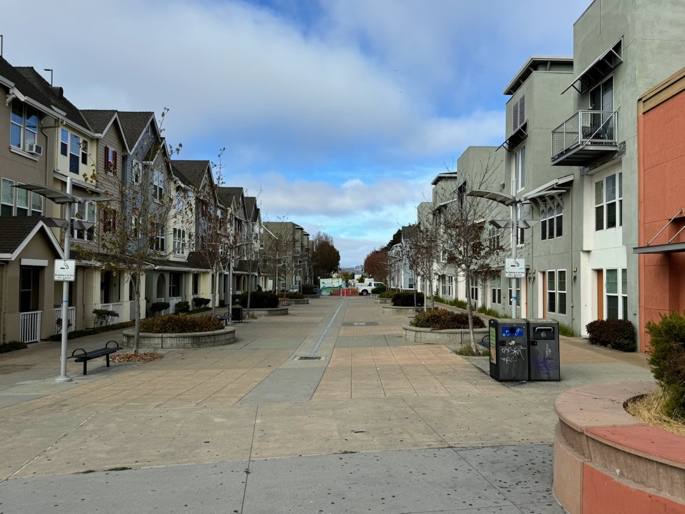
Housing village plaza, looking west along Nevin Avenue. Photo by the author, 2024.
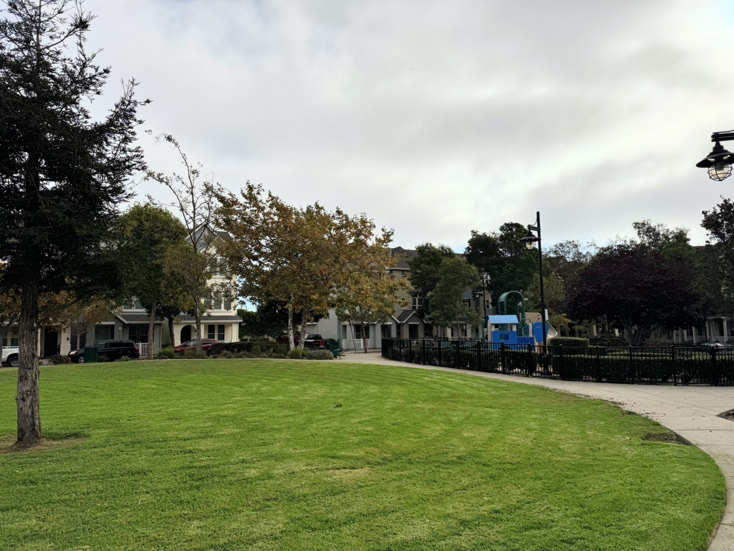
Housing village park and playground; unit garages are accessible from an alley behind the housing. Photo by the author, 2024.
Phase 2, the new intermodal station building, was completed in 2007. The station added an indoor lobby, a police substation, and an at-grade plaza. BART’s goal in 2004 was to increase boarding at Richmond from other stations via improved “security at the station.”8
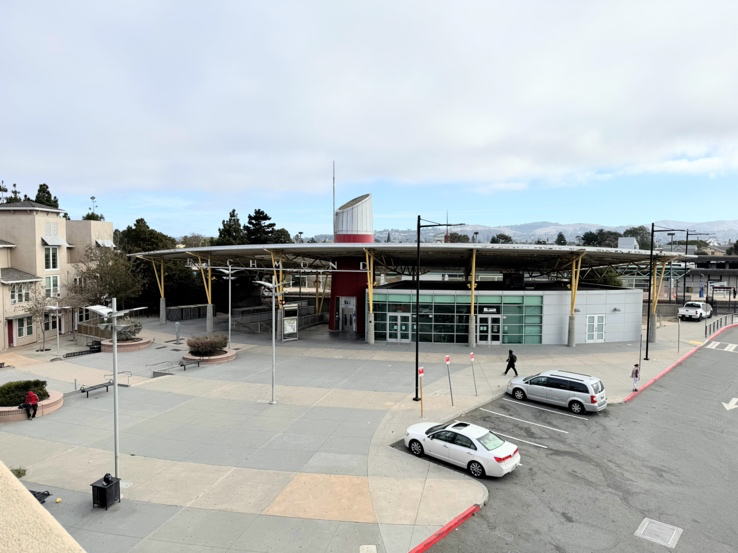
The intermodal station, completed in 2007. Photo by the author, 2024.
Phase 3 was completed in 2013 and included a renovated bus and taxi terminal and a new six-story parking structure with 9,000 square feet of retail.9 Throughout the project, BART planners stated that the garage was necessary before surface parking could be replaced with housing.10 In 2001, the California State Budget recession delayed the parking garage with the loss of $5 million in state funding.11 By 2013, Phase 3 cost $34.5 million, “with $28.4 million … coming from federal, state and local transportation grants.”12
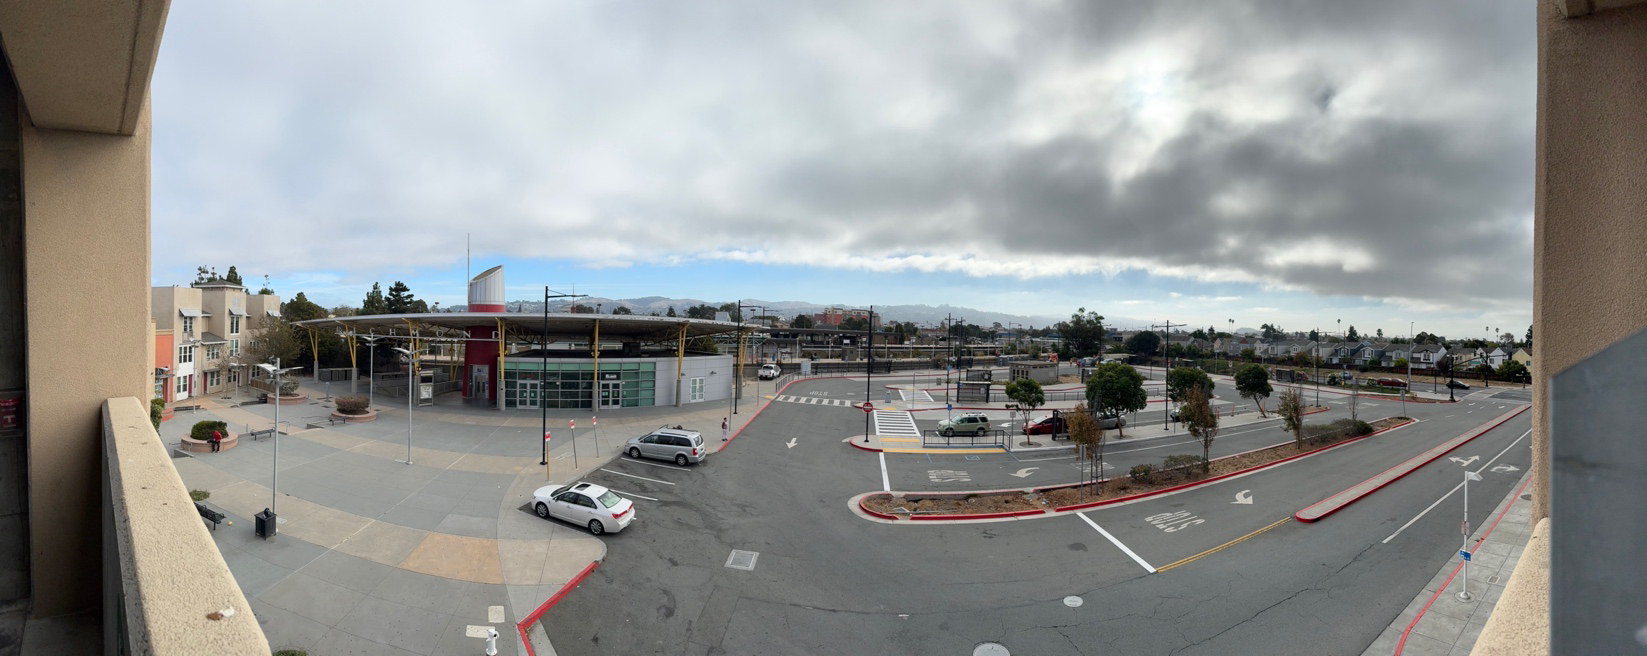
The bus and taxi terminal, viewed from the parking garage. Photo by the author, 2024.
Phase 4 was a Nevin Avenue streetscape project completed in 2017, connecting 19th Street to a new east-side BART entrance. The project included a drop-off cul-de-sac, elevator,13 native landscaping, sidewalk improvements, and bike parking.14 At the ribbon cutting, BART president Rebecca Saltzman stated: “by focusing on jobs and housing near BART, we can reduce greenhouse gas emissions.”15
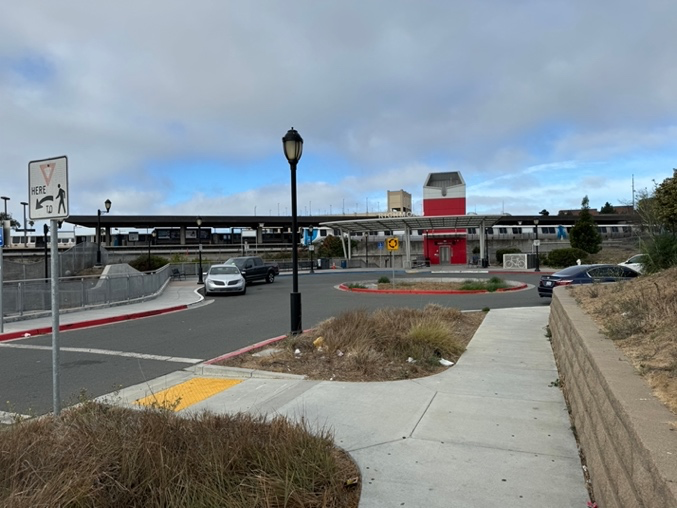
The east-side station entrance and drop-off cul-de-sac, looking west on Nevin Avenue. Photo by the author, 2024.
Phase 5 is still in progress;16 the first development currently in permitting adds 150 affordable housing units with bike and pedestrian access improvements.17 It is unconfirmed how much parking, if any, will be built.
Table 1. Project phases and their monetary costs
| Phase | Cost (millions) |
|---|---|
| 1: Village Housing | Unknown |
| 2: Intermodal Station | $6.4 ($10 adjusted) |
| 3: Parking Garage | $34.5 ($53.8 adjusted) |
| 4: Nevin Ave Streetscape | $4.3 ($5.6 adjusted) |
| 5: Future Metrowalk Housing | Est. $130 (to start) |
Impact
Impact of the Richmond Transit Village was analyzed from 2001–2019 BART entry ridership reports18 and BART Intercept Survey data from 1998, 2008, and 2015. Data on the neighborhood immediately surrounding Richmond Station (the “BART Neighborhood”) and the City of Richmond was collected from the U.S. Census.19 This analysis attempts to answer three questions: did the project achieve its goals of reducing greenhouse gas emissions via reduced driving; did it incur any negative costs to the surrounding neighborhood; and did it have other non-quantifiable impacts?
BART Ridership
BART entry ridership at Richmond Station changed at similar rates to its neighboring stations between 2001 and 2019 (Figure 3); project impact is not discernible from entry totals.20
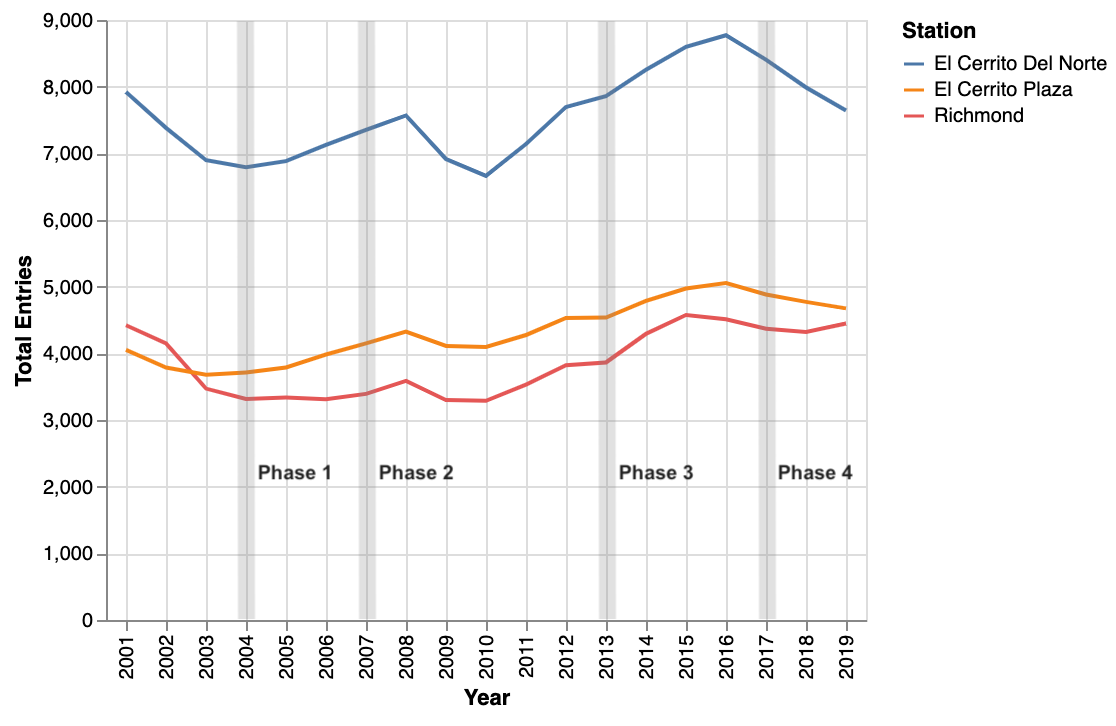
Figure 3. Richmond and El Cerrito BART total entries (2001–2019). Source: BART 2001–2023 ridership reports.
Richmond’s proportional ridership increased slightly in 2008 when neighboring stations were decreasing (Figure 4), and then again in 2013. It is possible the lack of decrease in 2007–2008 and the 2013–2015 increase was influenced by the project, although research cautions against attributing influence to built-form changes.21 Given the somewhat-inverse proportional entries of Richmond and El Cerrito del Norte between 2013–2019, it is possible that BART’s 2004 goal to “alleviate congestion at neighboring stations”22 did materialize.
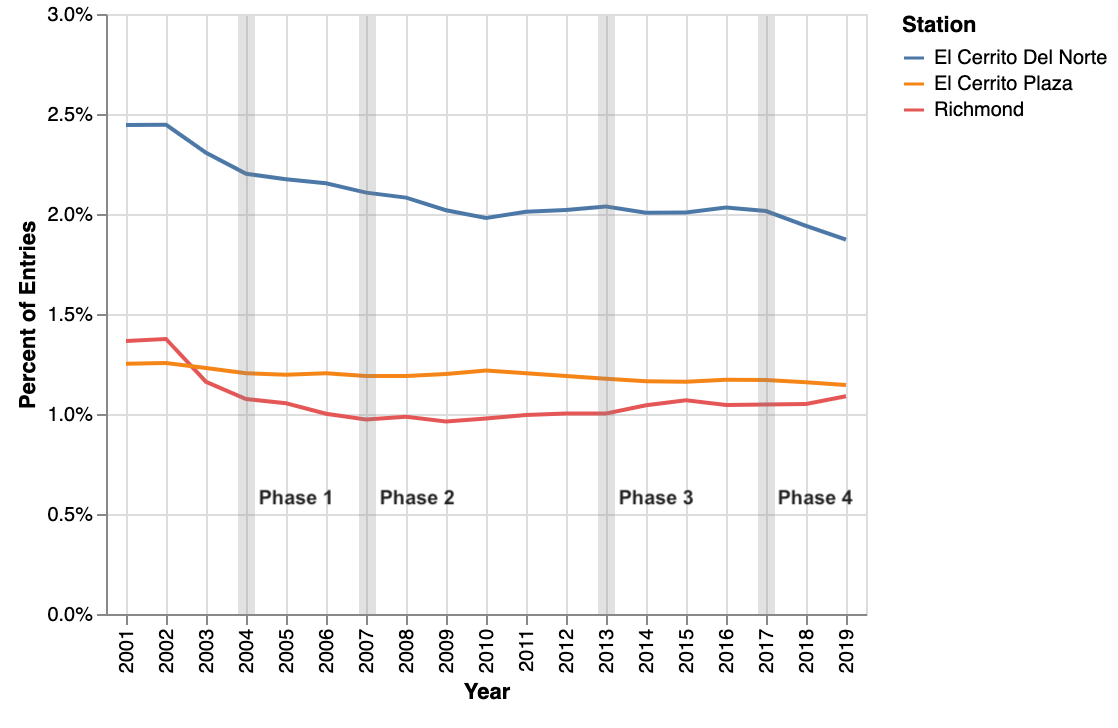
Figure 4. Richmond and El Cerrito BART entries proportional to systemwide (2001–2019). Source: BART 2001–2023 ridership reports.
By the 2010s, Richmond’s goals shifted to prioritizing BART Neighborhood density and non-vehicle accessibility to the station.23 In 1998, more Richmond Station riders drove to the station than the stationwide average (Figure 5), but in 2008 and 2015 driving to Richmond Station dropped to a lower rate than stationwide.
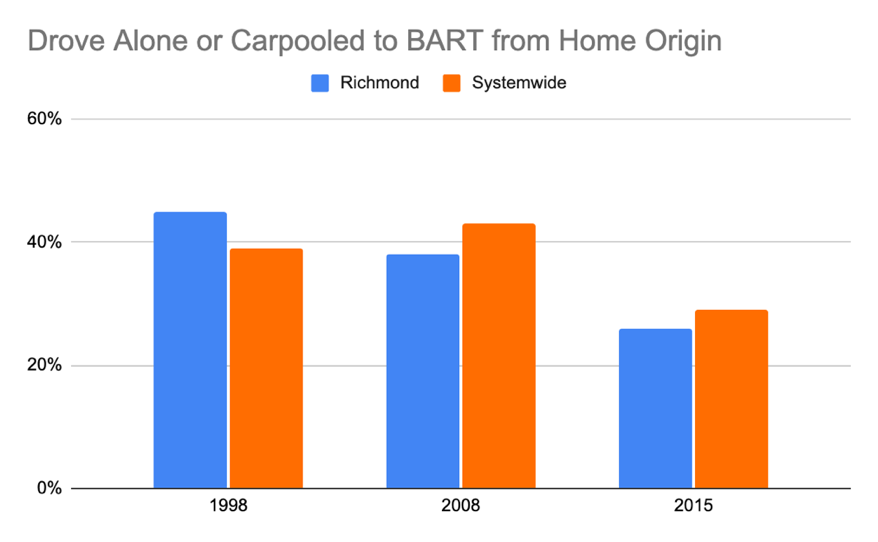
Figure 5. Proportion of BART riders that drove to the station from home. Notes: Richmond’s 2008 and 2015 margin of error is +/- 2% at a 90% confidence level; 1998 MoEs are unknown. “Driving” includes driving alone and carpooling. Source: BART 2008, 2015 surveys and BART’s 2004 Richmond Comprehensive Station Plan.
Between 1998 and 2015, walking or biking to both Richmond Station and stationwide steadily increased (Figure 6). In 2015, walking or biking to Richmond Station increased enough (to 40%) to have no statistically significant difference from stationwide (43%). It is possible that Phase 1 housing and the Phase 2 station reduced the share of driving and increased the share of walking or biking to BART.
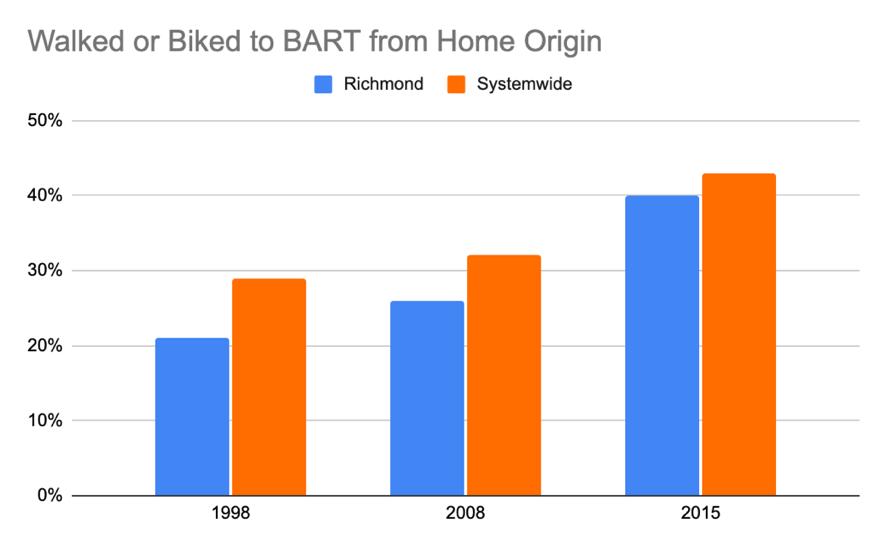
Figure 6. Proportion of BART riders that walked or biked to the station from home. Source: BART 2008, 2015 surveys and BART’s 2004 Richmond Comprehensive Station Plan.
The reduction of driving to Richmond BART happened despite a steady increase in car access.24 The pattern of increased walking or biking and decreased driving to Richmond Station does not appear in the overall trends of modes taken to work in the broader city or the BART Neighborhood.25 Between 2010 and 2019, the percentage of workers commuting by rail did not significantly change in either the city (9%) or BART Neighborhood (10%),2627 and vehicle commuting held steady (78%) for both.28 This suggests that the project did not convert vehicle commuters into BART riders.
Race and Ethnicity
Richmond Station is notable as a suburban commuter rail station in that it serves more riders of color than Non-Hispanic White riders (Figure 7).29 Between 1998 and 2015, Richmond saw a decrease of Non-Hispanic Black riders (Figure 8) and an increase of Hispanic riders (Figure 9), but this trend is consistent with the overall demographic changes of Richmond over the period.30
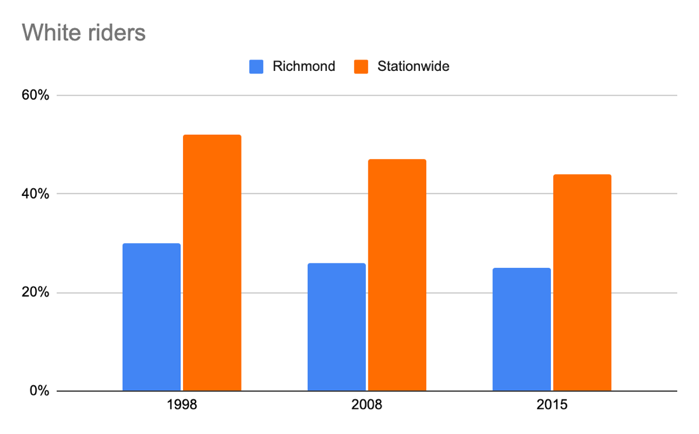
Figure 7. Proportion of Non-Hispanic White BART riders.
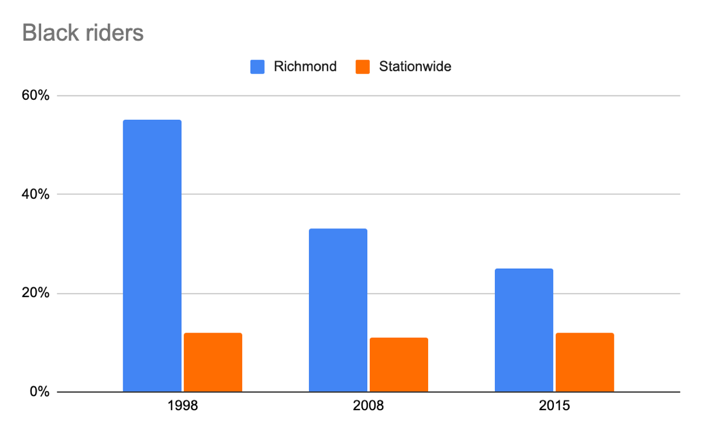
Figure 8. Proportion of Non-Hispanic Black BART riders.
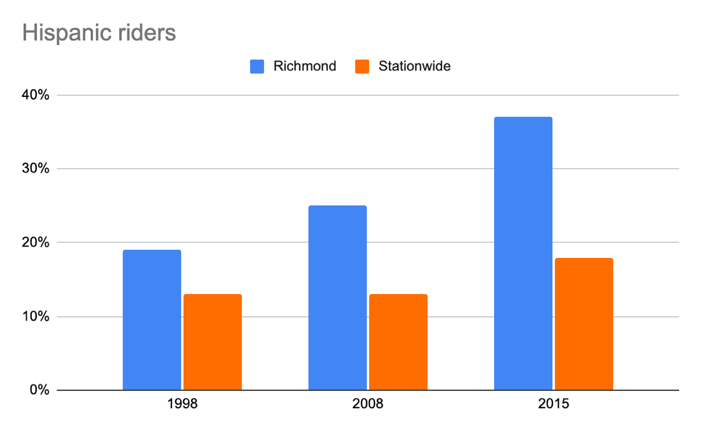
Figure 9. Proportion of Hispanic BART riders. Notes: Richmond’s 2008 and 2015 margin of error is +/- 2% at a 90% confidence level; 1998 MoEs are unknown. Source: BART 2008, 2015 surveys and BART’s 2004 Richmond Comprehensive Station Plan.
Between 2010 and 2019, the BART Neighborhood was less Non-Hispanic White (8%) compared to the city (18%) and more Hispanic (60%) than the city (41%).31 The project’s impact was not apparent in any race and ethnicity changes.32 Figure 10 compares BART Richmond Station ridership to the BART Neighborhood population. The significant difference between Non-Hispanic White riders (25%) and residents (8%) suggests those driving to and parking at the station were more likely to be White; the difference between Hispanic riders (37%) and residents (59%) suggests those walking to the station were more likely to be Hispanic.
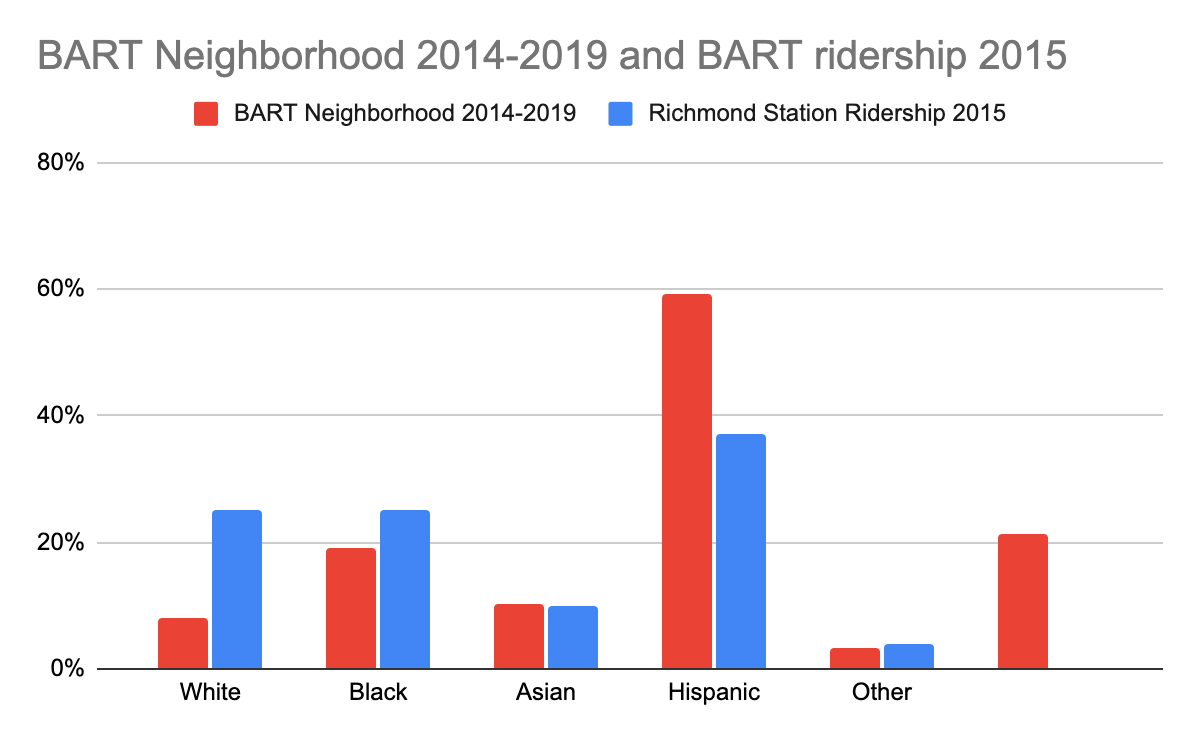
Figure 10. Race and ethnicity of the BART Neighborhood vs. BART Richmond ridership. Notes: differences are statistically significant (90% confidence) for the White, Black, and Hispanic populations. Source: BART 2015 survey; U.S. Census Bureau, 2014–2019 ACS 5-Year Estimates (Table B03002).
Housing Impacts
Between 2010 and 2019, the BART Neighborhood made up 25% of Richmond’s housing units, with almost no neighborhood change in total units or vacancies,33 and maintained a 62% rental rate, higher than the city’s 50%.34 Richmond saw a 15% increase (adjusted) of median rent in this time frame; two census tracts north of the station saw 25% and 23% increases.35 This is consistent with the Othering & Belonging Institute’s 2018 report, which attributed rent increases to side effects of the 2005–2008 foreclosure crisis.36 Because of this larger trend, it is unclear whether the Richmond Transit Village impacted neighborhood rent.
Zoning and Parking
The 2012 Richmond General Plan 2030 proposed zoning updates to turn the Macdonald Avenue Downtown37 into “high-density infill development … [to] maximize transit potential,”38 and the city’s 2016 zoning overhaul implemented these General Plan goals.39
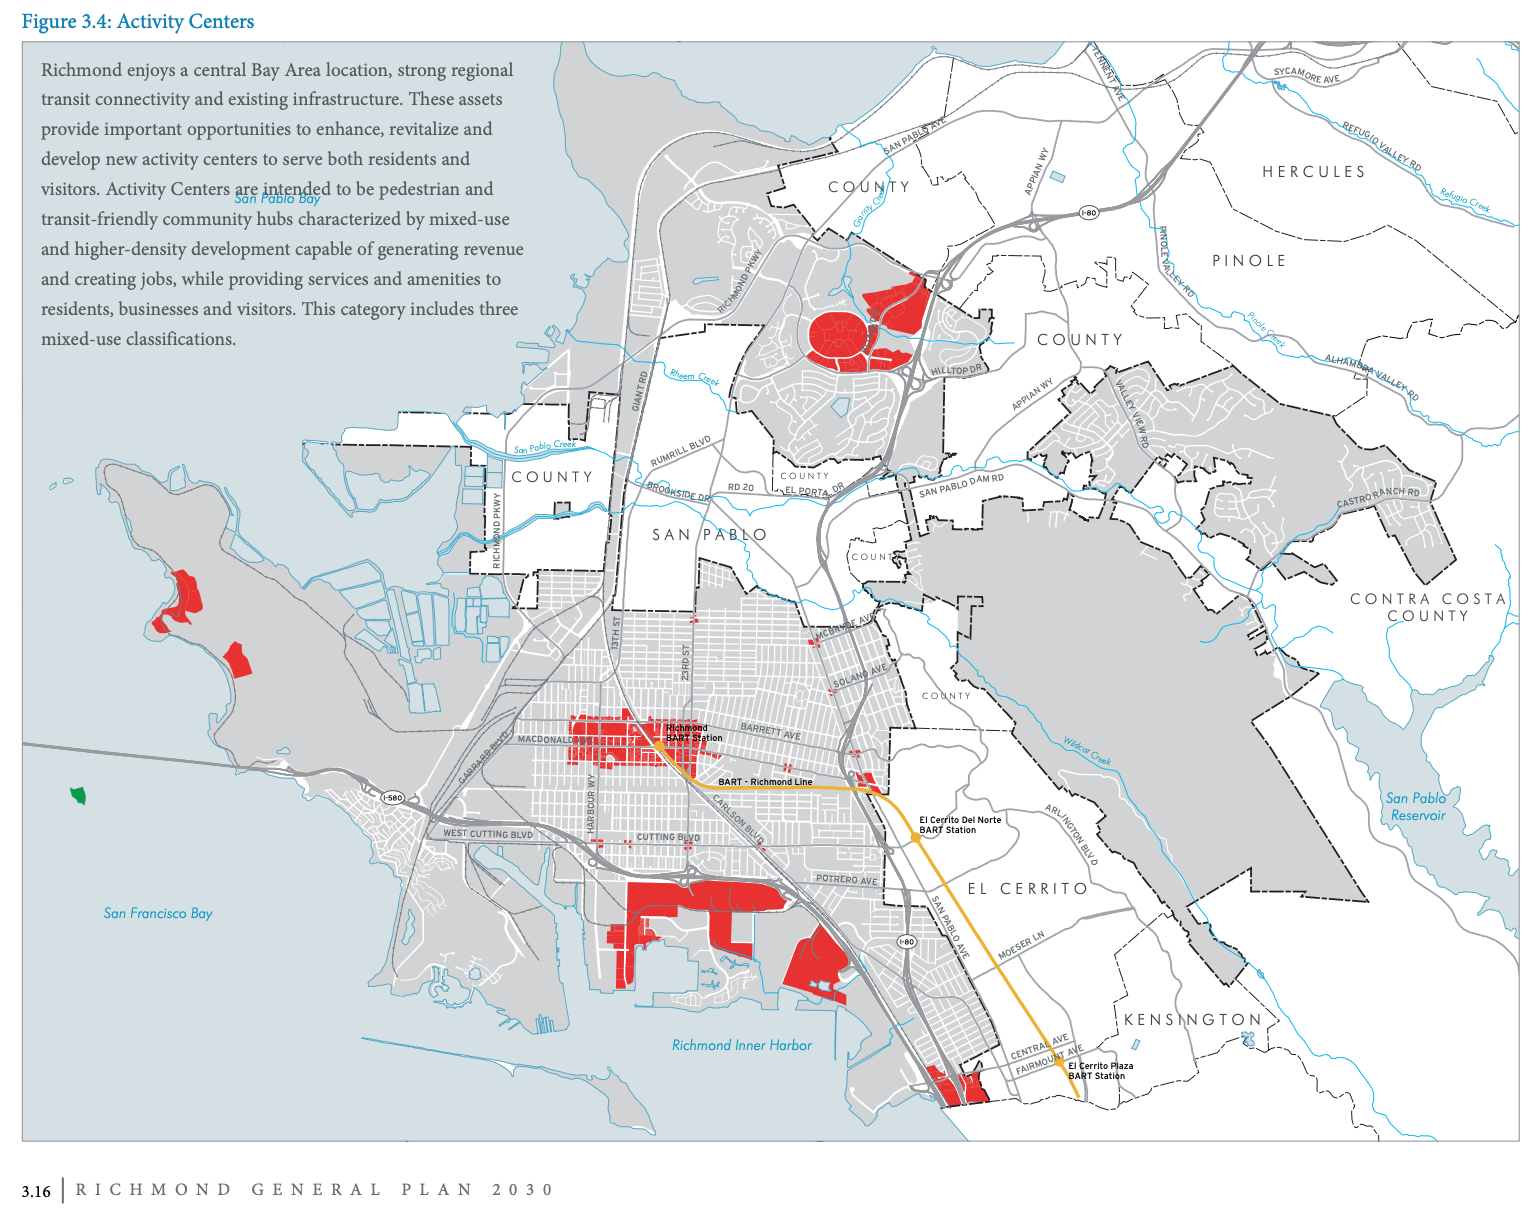
Left: the downtown “Activity Center” (in red) defined in the 2012 Richmond General Plan 2030.
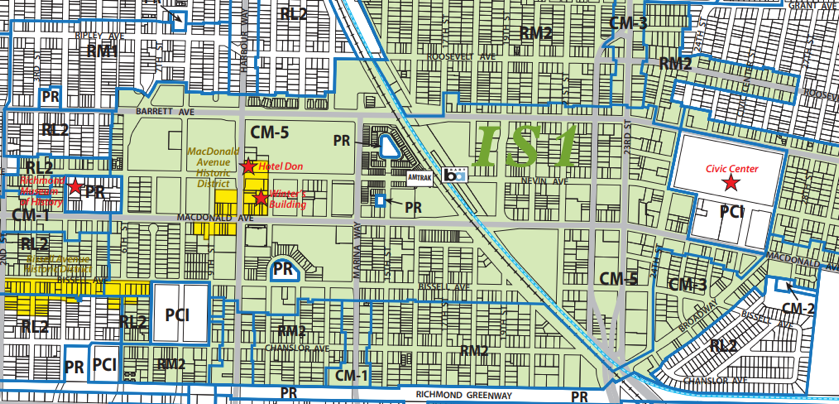
Right: the revised zoning categories for the BART Neighborhood; the green is the “Interim Study Overlay,” and historic buildings are highlighted in yellow. Source: City of Richmond Ordinance 16-16.
As part of the update, Richmond added incentives for building affordable housing by incorporating California’s housing density bonus law,40 which included reduced parking ratios.41 To comply with state policy, the city is removing parking requirements within ½ mile of public transit by 2025.42
Conclusion
The Richmond Transit Village set lofty goals,43 and after an enormous amount of time and money it did not decrease vehicle commuting in the city or BART Neighborhood.44 The 2004 housing can be characterized as “simply transit adjacent, with high amounts of parking, low density, and large units being offered for sale.”45
Despite this, the project appears to have positively impacted people’s lives. While causation is unclear, driving to the station has reduced, and the walking and biking accessibility improvements are being used with much greater frequency post-project. Given that walkers from the neighborhood were more likely to be people of color who rent their homes, historically marginalized groups in the city were the main beneficiaries of the investments. The project did not negatively impact neighborhood residents, as many other TOD projects do;46 vulnerable populations were not displaced via a shift of demographics, higher rents, or reduction of vehicle access.
In an ideal world, instead of the garage, the city could have reduced parking requirements47 and spent the $53+ million to fund local bus service to increase neighborhood accessibility.48 Given the current reality, it is notable that of the new housing developments proposed in the past decade in downtown Richmond,49 the one moving forward with secured funding is BART’s TOD, and the rest have increased their likelihood of getting built due to cost savings from California’s and BART’s reduced parking requirements. This integration of policy at all scales50 is what will ultimately reduce driving and the associated greenhouse gas emissions.
“Richmond, CA (RIC) – Great American Stations,” accessed October 23, 2024, https://www.greatamericanstations.com/stations/richmond-ca-ric/. ↩︎
Deidre Heitman, “Richmond Comprehensive Station Plan” (BART Planning Department, June 2004), 12, https://www.bart.gov/sites/default/files/docs/RichmondCSP.pdf. ↩︎
In 2002, the Macdonald Ave Downtown Richmond commercial area had an average density of 3,537–5,508 jobs per square mile, the highest-density area of the city. In 2022, the density was slightly higher at 3,669–5,726 jobs per square mile, and three other zones shared this density. Source: U.S. Census Bureau, LEHD Origin-Destination Employment Statistics (2002–2022), https://onthemap.ces.census.gov. LODES 8.3. ↩︎
“Transit-Oriented Development (TOD) | Bay Area Rapid Transit,” accessed November 29, 2024, https://www.bart.gov/about/business/tod. ↩︎
Heitman, “Richmond Comprehensive Station Plan,” 12. ↩︎
At signing, the project was funded and supported by the Richmond Community Redevelopment Agency, BART, and the West Contra Costa Transportation Advisory Committee. Heitman, 13. ↩︎
Project facts: “Olson Homes Transit | Olson Homes,” accessed November 29, 2024. The retail space originally built in 2004 sat empty until 2012, and all is still empty today except for the deli next to the station. Rachel Waldholz, “Deli, Planned Parenthood Fill Long-Empty Retail Spaces at Transit Village,” Richmond Confidential, March 26, 2012, https://richmondconfidential.org/2012/03/26/deli-planned-parenthood-fill-long-empty-retail-spaces-at-transit-village/. ↩︎
Heitman, “Richmond Comprehensive Station Plan,” 13. BART’s president at the 2007 ribbon cutting, Lynette Sweet, stated “One of the best things about it is that the Transit Center will also house a new, joint Richmond and BART police substation, whose presence will help to deter crime.” (“BART Cuts Ribbon on Stylish, New Richmond Transit Center | Bay Area Rapid Transit,” accessed October 23, 2024.) ↩︎
“Richmond BART Parking Structure Set to Open next Month – East Bay Times,” accessed December 1, 2024, https://www.eastbaytimes.com/2013/04/18/richmond-bart-parking-structure-set-to-open-next-month/. ↩︎
Robert Rogers, “Breaking Ground on Downtown Project,” Richmond Confidential, August 10, 2010, https://richmondconfidential.org/2010/08/10/breaking-ground-on-downtown-project/. ↩︎
Heitman, “Richmond Comprehensive Station Plan,” 26. ↩︎
The rest of the $6.1 million came from the city’s then-dissolved Redevelopment Agency. “Richmond BART Parking Structure Set to Open next Month – East Bay Times.” ↩︎
Mayor Tom Butt and BART Directors Saltzman, “City and BART Leaders to Commemorate Completion of Transit Village Project,” 2017. ↩︎
“Richmond, CA (RIC) – Great American Stations.” ↩︎
KCRT’s NewsBytes: BART Transit Village Access Phase II, 2017, https://www.youtube.com/watch?v=xkTYZCy0Ktg. ↩︎
“Metro Walk Phase II Presentation,” 2018. Phase 5 was previously delayed because of the 2012 dissolution of all California redevelopment agencies. Elly Schmidt-Hopper, “Long Neglected, Richmond’s Downtown Is Being Slowly Reborn,” Richmond Confidential, December 21, 2014, https://richmondconfidential.org/2014/12/21/long-neglected-richmonds-downtown-is-being-slowly-reborn/. ↩︎
“$130 Million Transit-Oriented Housing Project to Add 150 Affordable Apartments at BART,” Grandview Independent, September 27, 2023, https://www.grandviewindependent.com/130-million-transit-oriented-housing-project-richmond-bart/. ↩︎
All BART survey data used in this report is filtered to riders who enter BART from a home origin, because in the 2008 and 2015 BART surveys there were not enough non-home-origin trips at Richmond to be included (fewer than 300 in 2008, fewer than 200 in 2015). BART ridership data here also includes only Entries. BART prioritized Entries in its 2004 Station Profile: “During the morning commute hours, Richmond is more often the point of entry to the system for many residents rather than a destination … Eighty-six percent (86%) of riders at Richmond use BART to get to work or school.” (Heitman, “Richmond Comprehensive Station Plan,” 17.) ↩︎
The “BART Neighborhood” is made of the census tracts immediately surrounding the station within ¼ mile: 375000, 376000, 377000, 374000, 381000. Because some of these tracts extend beyond the ¼- or ½-mile range, this analysis could be improved by weighting each tract proportional to its relevant area. Data is from the U.S. Census 5-year ACS estimates of 2010–2014 and 2014–2019. ↩︎
BART ridership trends between 2001–2019 appear to track economic trends, with an overall increase of Entries over time interrupted by downturns. The decrease from 2001–2004 can be attributed to the dot-com bubble burst; the reduction after 2008 to the recession and subprime mortgage crisis. ↩︎
As Chatman reminded us in 2008, “providing attractive environments and uses accessible to walkers and transit users may not alter travel behavior significantly.” Daniel G. Chatman, “Deconstructing Development Density: Quality, Quantity and Price Effects on Household Non-Work Travel,” Transportation Research A 42, no. 7 (2008): 1026, https://doi.org/10.1016/j.tra.2008.02.003. ↩︎
Heitman, “Richmond Comprehensive Station Plan,” 8. ↩︎
In Richmond’s 2030 General Plan (2012), one of the highest priorities was “elevating environmentally-friendly modes of travel and expanding transportation choices so that walking, bicycling, public transit and off-street modes of travel become more attractive options” (“Circulation Element, Richmond General Plan 2030,” 4.20), and that “high-density infill development will be accompanied by economic development … and maximize transit potential” (“Land Use and Design Element, Richmond General Plan 2030,” 25). ↩︎
In 2008, 36% of Richmond Station riders had zero vehicle access in their household, which dropped to 14% in 2015. In 2008, 32% of riders stationwide had zero vehicle access, which dropped to 13% in 2015. “Station Profile Study | Bay Area Rapid Transit,” accessed December 1, 2024, https://www.bart.gov/about/reports/profile. ↩︎
Vehicle-ownership changes in the BART Neighborhood and city between 2010–2014 and 2014–2019 were largely not statistically significant. U.S. Census Bureau, 2010–2014 and 2014–2019 ACS 5-Year Estimates (Table B08141). ↩︎
To address potential employment shifts that would influence BART commuter ridership, the proportion of Richmond residents employed outside the city held steady around 89% from 2002–2021. Source: U.S. Census Bureau, LEHD Origin-Destination Employment Statistics (2002–2022), https://onthemap.ces.census.gov. LODES 8.3. ↩︎
In 2010–2014, 11.8% of workers 16+ commuted via rail in the BART Neighborhood, greater than the 8.8% in the city, but the difference was not statistically significant. U.S. Census Bureau, 2010–2014 and 2014–2019 ACS 5-Year Estimates (Table B08006). ↩︎
U.S. Census Bureau, 2010–2014 and 2014–2019 ACS 5-Year Estimates (Table B08006). ↩︎
BART noted this distinction in its 2004 Station Report, based on its 1998 survey: “BART riders who use the Richmond station have a very different profile from that of the system as a whole. Richmond riders tend to be female, persons of color, and have a lower household income than other BART riders.” (Heitman, 19.) Research shows commuter rail networks including BART tend to serve white populations (Aaron Golub, Richard A. Marcantonio, and Thomas W. Sanchez, “Race, Space, and Struggles for Mobility,” Urban Geography 34, no. 5 (2013): 700, https://doi.org/10.1080/02723638.2013.778598), and TODs often support white mobility and growth while excluding lower-income minority residents (Gwendolyn Y. Purifoye, “Transit Boundaries,” Mobilities 15, no. 4 (2020): 1). ↩︎
K. Chapple, T. Thomas, and M. Zuk, “Rising Housing Costs and Re-Segregation in Contra Costa County,” Urban Displacement Project (UC Berkeley, 2019), 4–5, https://www.urbandisplacement.org/. ↩︎
U.S. Census Bureau, 2010–2014 and 2014–2019 ACS 5-Year Estimates (Table B03002). ↩︎
Between 2010–2014 and 2014–2019, the only statistically significant racial change in the BART Neighborhood was a 5% increase in the Non-Hispanic Asian population; the city saw no significant change. Further investigation is beyond the scope of this paper. U.S. Census Bureau, ACS 5-Year Estimates (Table B03002). ↩︎
Between 2010–2014 and 2014–2019, Richmond saw a statistically significant increase in occupancy, from 91.5% to 93.5%; the BART Neighborhood maintained around 90% occupancy. U.S. Census Bureau, ACS 5-Year Estimates (Table B25002). ↩︎
U.S. Census Bureau, 2010–2014 and 2014–2019 ACS 5-Year Estimates (Table B25003). ↩︎
The three census tracts to the south saw no change in median rent. Increases in tracts north of the station (375000 and 376000) were statistically significant at a 90% confidence level. U.S. Census Bureau, ACS 5-Year Estimates (Table B25058). ↩︎
“Housing Policy and Belonging in Richmond” (Othering & Belonging Institute), January 2018, https://belonging.berkeley.edu/housing-policy-and-belonging-richmond. ↩︎
“Land Use and Design Element, Richmond General Plan 2030,” 3.16. ↩︎
“Land Use and Design Element, Richmond General Plan 2030,” 3.25. ↩︎
The Richmond Station and its surrounding area changed from “CB: Central-Business” to “Commercial Mixed-Use, Activity Center” with an “Interim Study Overlay,” giving it the flexibility “to allow discretionary review of development proposals in areas where changes in zoning regulations are contemplated or under study.” Ordinance No. 16-16 (2016), https://www.ci.richmond.ca.us/. ↩︎
Karen Wang, “Richmond Transit Village: Partnerships in Building Housing,” Home for All (blog), October 26, 2018, https://homeforallsmc.org/richmond-transit-village-partnerships-in-building-housing/. ↩︎
“Community Development Director Bulletin Regarding California Density Bonus Law,” City of Richmond, accessed December 6, 2024. ↩︎
Richmond is eliminating parking minimums within ½ mile of public transit to comply with California AB 2923, a state law about BART TODs. Richmond did not adopt AB 2923 by the 2022 deadline but is working on it, so BART’s TOD parking-minimum removal currently applies for Phase 5. “6th Cycle Housing Element Update (2023–2031)” (City of Richmond, 2023); “A Technical Guide to Zoning for AB 2923 Conformance” (BART); AB 2923 (chaptered), https://leginfo.legislature.ca.gov/. ↩︎
The goals stated by politicians, nonprofits, and Richmond and BART planners parroted the TOD goals set forth in legislation and reports from BART, the Metropolitan Transportation Commission, and the State of California: reduce greenhouse gas emissions from vehicle miles traveled by increasing density and activity around transit. As one academic framing puts it: “enhancing a city’s economic competitiveness, reduce local pollution and global greenhouse gas emissions, and promote inclusive development.” (Hiroaki Suzuki, Robert Cervero, and Kanako Iuchi, Transforming Cities with Transit (World Bank, 2013), 1.) ↩︎
Susan Handy, “Smart Growth and the Transportation-Land Use Connection: What Does the Research Tell Us?,” International Regional Science Review 28, no. 2 (2005): 19, https://doi.org/10.1177/0160017604273626. ↩︎
Daniel G. Chatman, “Does TOD Need the T?,” Journal of the American Planning Association 79, no. 1 (2013): 29. ↩︎
“[Historic immobility] has resulted in Blacks … being entangled in sequestered spaces of the city that are often ‘forgotten’ during capital investment campaigns … [and] these Black spaces also often bear the burdens of the city’s growth machine.” (Purifoye, “Transit Boundaries,” 2.) ↩︎
Gabbe’s 2020 research in Seattle shows that “many or most developers will respond to parking reforms, particularly if they are focused in neighborhoods with good walkability and transit options,” and the 40% reduction of parking built in the five years after Seattle’s reform saved an estimated $537 million. C. J. Gabbe, Gregory Pierce, and Gordon Clowers, “Parking Policy: The Effects of Residential Minimum Parking Requirements in Seattle,” Land Use Policy 91 (2020): 104053, https://doi.org/10.1016/j.landusepol.2019.104053. ↩︎
Based on Golub’s 2013 paper on Bay Area transit inequalities: “inadequate funding of urban bus service has contributed powerfully to the continued isolation of inner core communities.” (Golub, Marcantonio, and Sanchez, “Race, Space, and Struggles for Mobility,” 722.) ↩︎
“$130 Million Transit-Oriented Housing Project to Add 150 Affordable Apartments at BART.” ↩︎
As Barbour put it, “in order to substantially reduce VMT and associated GHGs from passenger travel, integrated planning for TOD, transit, and active transport needs to occur at the metro regional and subregional scales … not just at the local level.” Since AB 2923 applies only to BART TODs, an improved state law would apply broadly across California. Elisa Barbour and Gian-Claudia Sciara, “Reducing Motor Vehicle GHG Emissions via Land-Use and Transport Integration,” 2023, 317. ↩︎