By Mary Becica, in support of Climate Justice Coalition for California Prisons
Extreme heat is a documented health hazard inside California’s prisons: each day roughly 10°F above a prison’s normal summer temperature raises all-cause mortality by about 5.2%, hotter days bring a roughly 20% rise in daily violent incidents, and extreme heat increases suicide-watch incidents and heat illness. The danger is greatest for people on psychiatric medications that impair the body’s ability to cool itself; roughly 75% of California’s incarcerated population has an identified behavioral health need that prisons commonly treat with such medication. In a 2023 survey of incarcerated Californians who had lived through an extreme heat event, 44% reported fearing for their lives.
Heat threatens the people who work inside as well: many incarcerated Californians hold prison jobs, where days above 80°F raise the risk of workplace injury by roughly 3% and days above 90°F by 10%, and the officers and staff who run these facilities face the same conditions. California adopted its first indoor heat standard for workplaces in 2024, but the Cal/OSHA standards board excluded prisons and jails over the cost of bringing correctional facilities into compliance.
California’s prison medical care has been under federal Receivership since 2006, after Plata v. Newsom found the state’s prison health care unconstitutional. The Receiver monitors the adequacy of care at every institution, and one result has been a steady expansion of public health-care reporting, most visibly the California Correctional Health Care Services (CCHCS) data dashboards.
Heat has been part of that court-supervised mandate even longer: in 1995, the Coleman ruling on prison mental health care required CDCR to adopt a Heat Illness Prevention Plan, built around escalating “heat stages” that set the required response to dangerous temperatures at all 31 prisons.
CDCR Heat Stages and Required Responses
| Stage | Trigger | Response (summary) |
|---|---|---|
| Stage I | Outdoor temperature above 90°F | Heat-vulnerable people moved indoors for recreation; time outdoors limited |
| Stage II | Indoor temperature above 90°F | Move to air-conditioned space; fans, water, ice, and more frequent showers; nursing tours housing units more often |
| Stage III | Indoor temperature above 95°F | Stage II measures continue; nursing staff check each person at least every two hours |
The Heat Plan requires staff to record indoor temperatures every three hours in every housing unit from May through October, largely by hand on basic thermometers; a 2025 audit by the Office of the Inspector General (OIG) found that staff at the prisons it reviewed did not consistently complete these logs. Even where logging does occur, CDCR has never published a public record of the readings or of heat-stage activations. This memo lays out exactly what has been reported.
CDCR collects heat data but publishes almost none of it
Very little is public, and what exists does not provide a usable picture of who faces dangerous heat, or where:
What CDCR has published
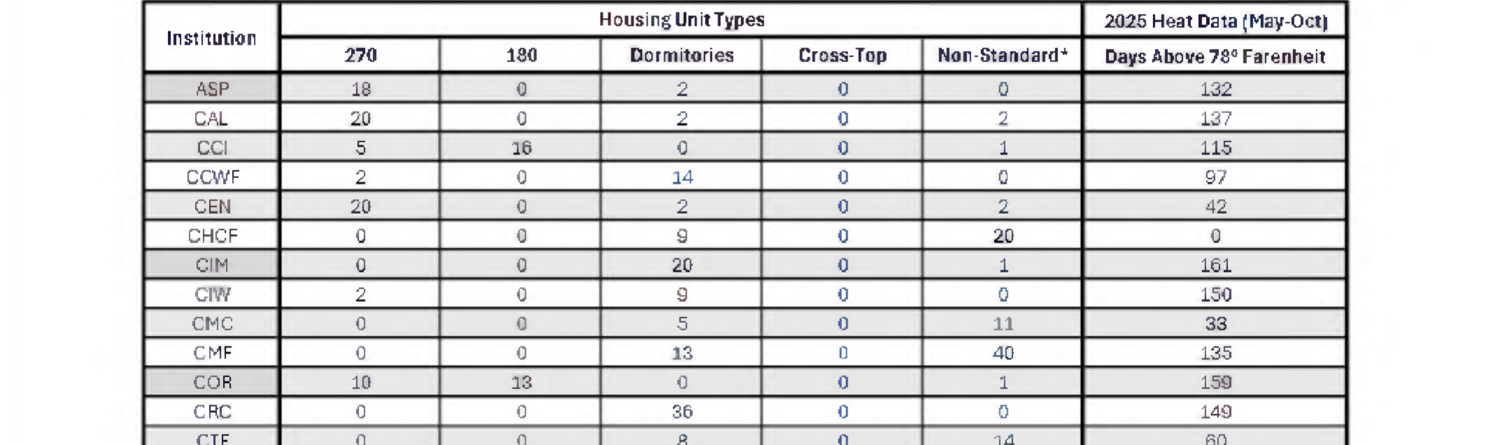
The only indoor temperature measurement CDCR has released is a table in the Air Cooling Pilot Program Supplemental Report (January 2026), which reports the number of days each housing unit type exceeded 78°F between May and October 2025. It is a single year of data, a single threshold, manually reported, with no detail on where or how often temperatures were taken. CDCR has also reported systemwide heat-stage day counts for 2023 and 2024 in its June 2025 report Climate and the Impact on CDCR, but these are aggregate tallies — the number of calendar days on which any facility, anywhere in the state, activated a stage — and cannot be broken out by prison. The OIG’s 2025 audit of temperature conditions in California’s prisons reviewed housing-unit heat logs from 2022–2023, but only at three facilities, and only to assess compliance rather than to build a public dataset.
The 78°F threshold in that one indoor report matches none of the operational heat stages, which trigger at 90°F and 95°F; it does not match California’s indoor workplace heat rule either, which uses 82°F and 87°F.
Figure 1. CDCR’s Housing Unit Types and Heat Data for 2025
What CDCR doesn’t publish
CDCR keeps no public per-facility record of heat-stage activations. The only counts it releases are the statewide calendar-day tallies noted above; nothing public shows how many days an individual prison spent under a Stage I, II, or III alert, or how that has changed over time.
There is also no continuous temperature record the public can see, indoors or out. The only indoor data is the single-year, hand-logged snapshot in the Air Cooling Pilot report; no prison has a continuous indoor record. Outdoor conditions are knowable only through outside sources: this analysis reconstructed them from ordinary publicly available weather data, which shows an average of 88 days above 90°F per facility each year between 2016 and 2025 (Figure 2). CDCR records outdoor temperatures hourly at every institution under the Heat Plan, but does not publish them.
Knowing who faces dangerous heat also requires knowing who is heat-vulnerable, and that count is not public either. CDCR’s Heat Plan already identifies these individuals: during Stage II and III alerts, staff must give extra monitoring to incarcerated people on medications that impair the body’s ability to cool itself. CCHCS publishes medical risk group counts for each facility, but neither CDCR nor CCHCS reports how many people at each prison are on that heat-risk list or are otherwise flagged as heat-vulnerable.
CDCR already collects the data its own heat plan depends on, and the Receivership has shown the department can report health data publicly when required to. It has not done so for heat. CDCR should release a consolidated, facility-level historical record of heat-stage activations, indoor and outdoor temperatures, and the number of heat-vulnerable people at each prison: the minimum the public, the courts, and the people living inside these prisons need to hold the state accountable for the heat plan and to keep people safe.
Figure 2. Average Annual Days Above 90°F per Prison (2016–2025)
More on the data and methods behind this memo can be found in the California prison climate justice repository.