Appendix A: California Incarceration and Corrections Trends
The population and budget figures cited throughout this capstone are compiled from primary California government sources into structured datasets (Becica, 2026c). This appendix describes the sources and methods behind the two figures and supporting data in the Background and the summary data in the Conclusions.
California incarceration rate per 100,000 residents (1920–2025). State prison population data for 1920–2014 is drawn from CDCR historical records as compiled by Zimring and Hawkins. From 2015–2018, December snapshots are extracted from CDCR’s semi-annual Offender Data Points PDF reports (Institution Population + Fire Camp Population + DSH beds; excludes contract beds and Community Reentry Program Participants). From 2019–2025, December 31 snapshots are from CDCR’s Monthly Report of Population (Tpop1d series). California resident population is from the Federal Reserve Economic Data (FRED) CAPOP series, sourced from U.S. Census Bureau estimates. The incarceration rate is calculated as the state prison population per 100,000 California residents.
Parole data for 2000–2009 is from Bureau of Justice Statistics Annual Parole Survey bulletins; 2010–2013 and 2020–2022 are read from Legislative Analyst’s Office (LAO) data visualizations; 2014–2019 are from CDCR Data Points reports; 2023 is from CDCR’s Population Dashboard; and 2024–2025 are from CDCR Tpop1d reports. County jail population for 2000–2024 is summed from the Board of State and Community Corrections (BSCC) Jail Profile Survey across all reporting counties. County probation caseloads for 2003–2024 are from the California Department of Justice Criminal Justice Statistics Center (OpenJustice).
CDCR spending as a share of the general fund (FY 1980–81 to 2024–25). Total CDCR budget data is compiled from Governor’s Budget Summaries, LAO annual Budget Analyses, California Budget & Policy Center issue briefs, and Bureau of Justice Statistics State Corrections Expenditures reports. Of the 46 fiscal years covered, 41 use figures reported directly from primary sources; five years (FY 1984–85 through 1986–87, 1989–90, and 1990–91) use linear interpolation between known anchor points. Program-level expenditure breakdowns (adult operations, parole operations, rehabilitative programs) for FY 2011–12 onward are extracted from Governor’s Budget chapter 5210 PDFs. All dollar figures are adjusted to 2024 dollars using the CPI-U annual average (BLS CPIAUCSL series, 1982–84 = 100), with the formula: real value = nominal value × (314.2 / CPI-U for that fiscal year).
Community supervision population and spending, 2011–2024. The Background references a 44.1% decline in California’s combined parole and county supervision population alongside a 17.6% increase in real spending between 2011 and 2024. Population figures combine state parole (from CDCR sources listed above) and county probation, Post-Release Community Supervision (PRCS), and mandatory supervision caseloads (from the California Department of Justice and Chief Probation Officers of California). Spending combines state parole operations expenditures (from Governor’s Budget chapter 5210) and county probation expenditures (from the California State Controller’s Office ByTheNumbers portal, all governmental funds). All spending figures are in 2024 dollars.
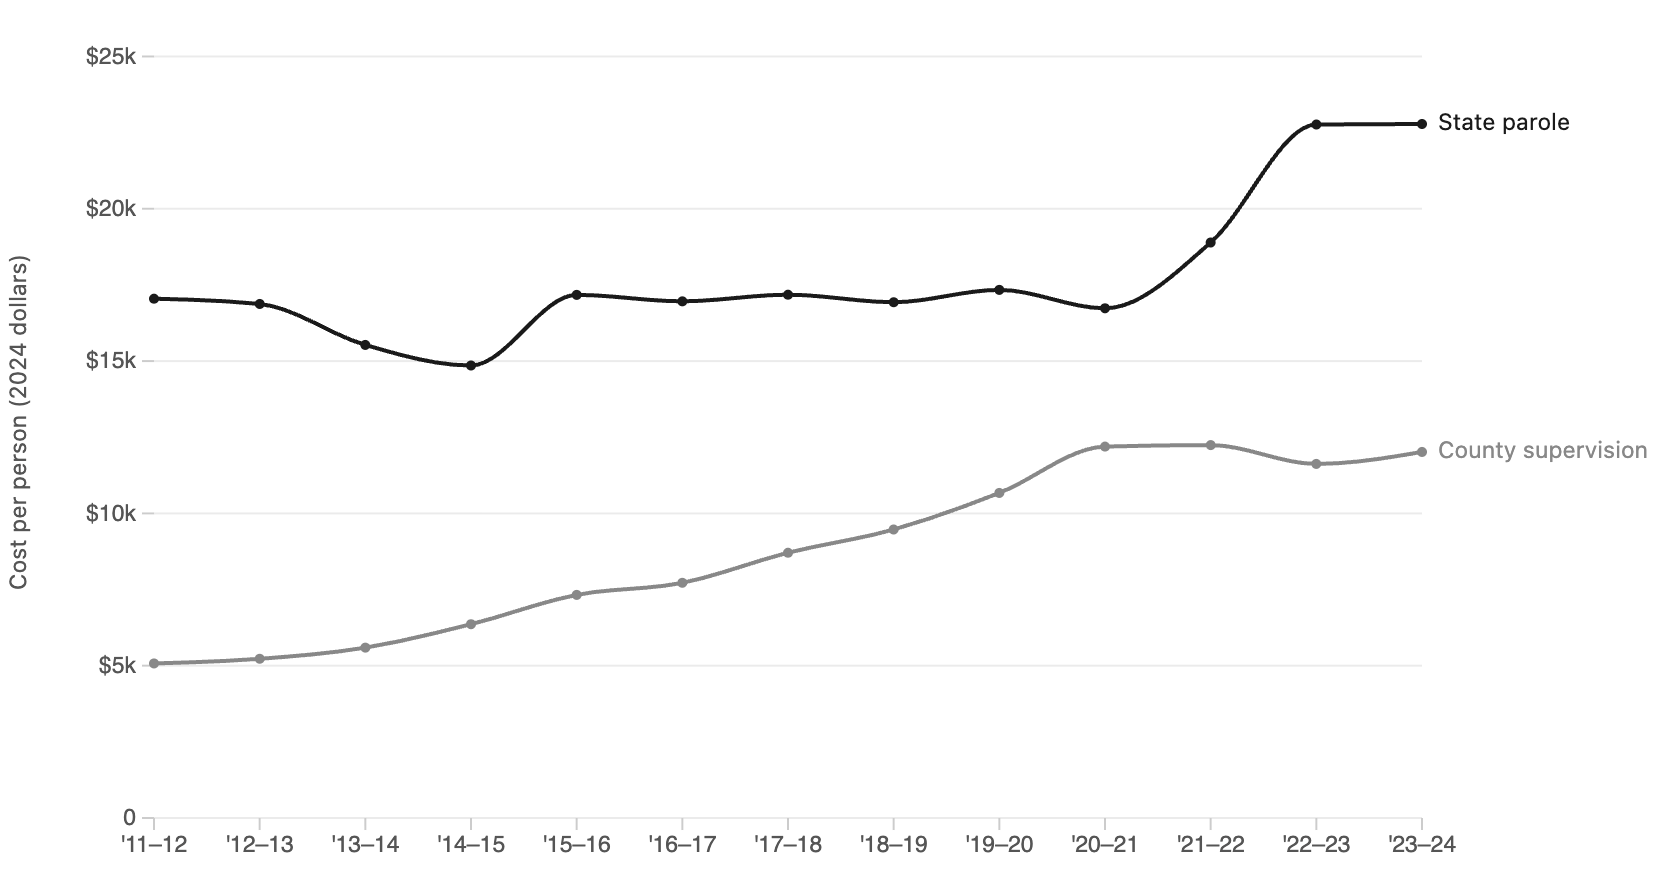
Figure 4. California community corrections cost per person after the 2011 realignment, FY 2011–12 to 2023–24, in 2024 dollars.
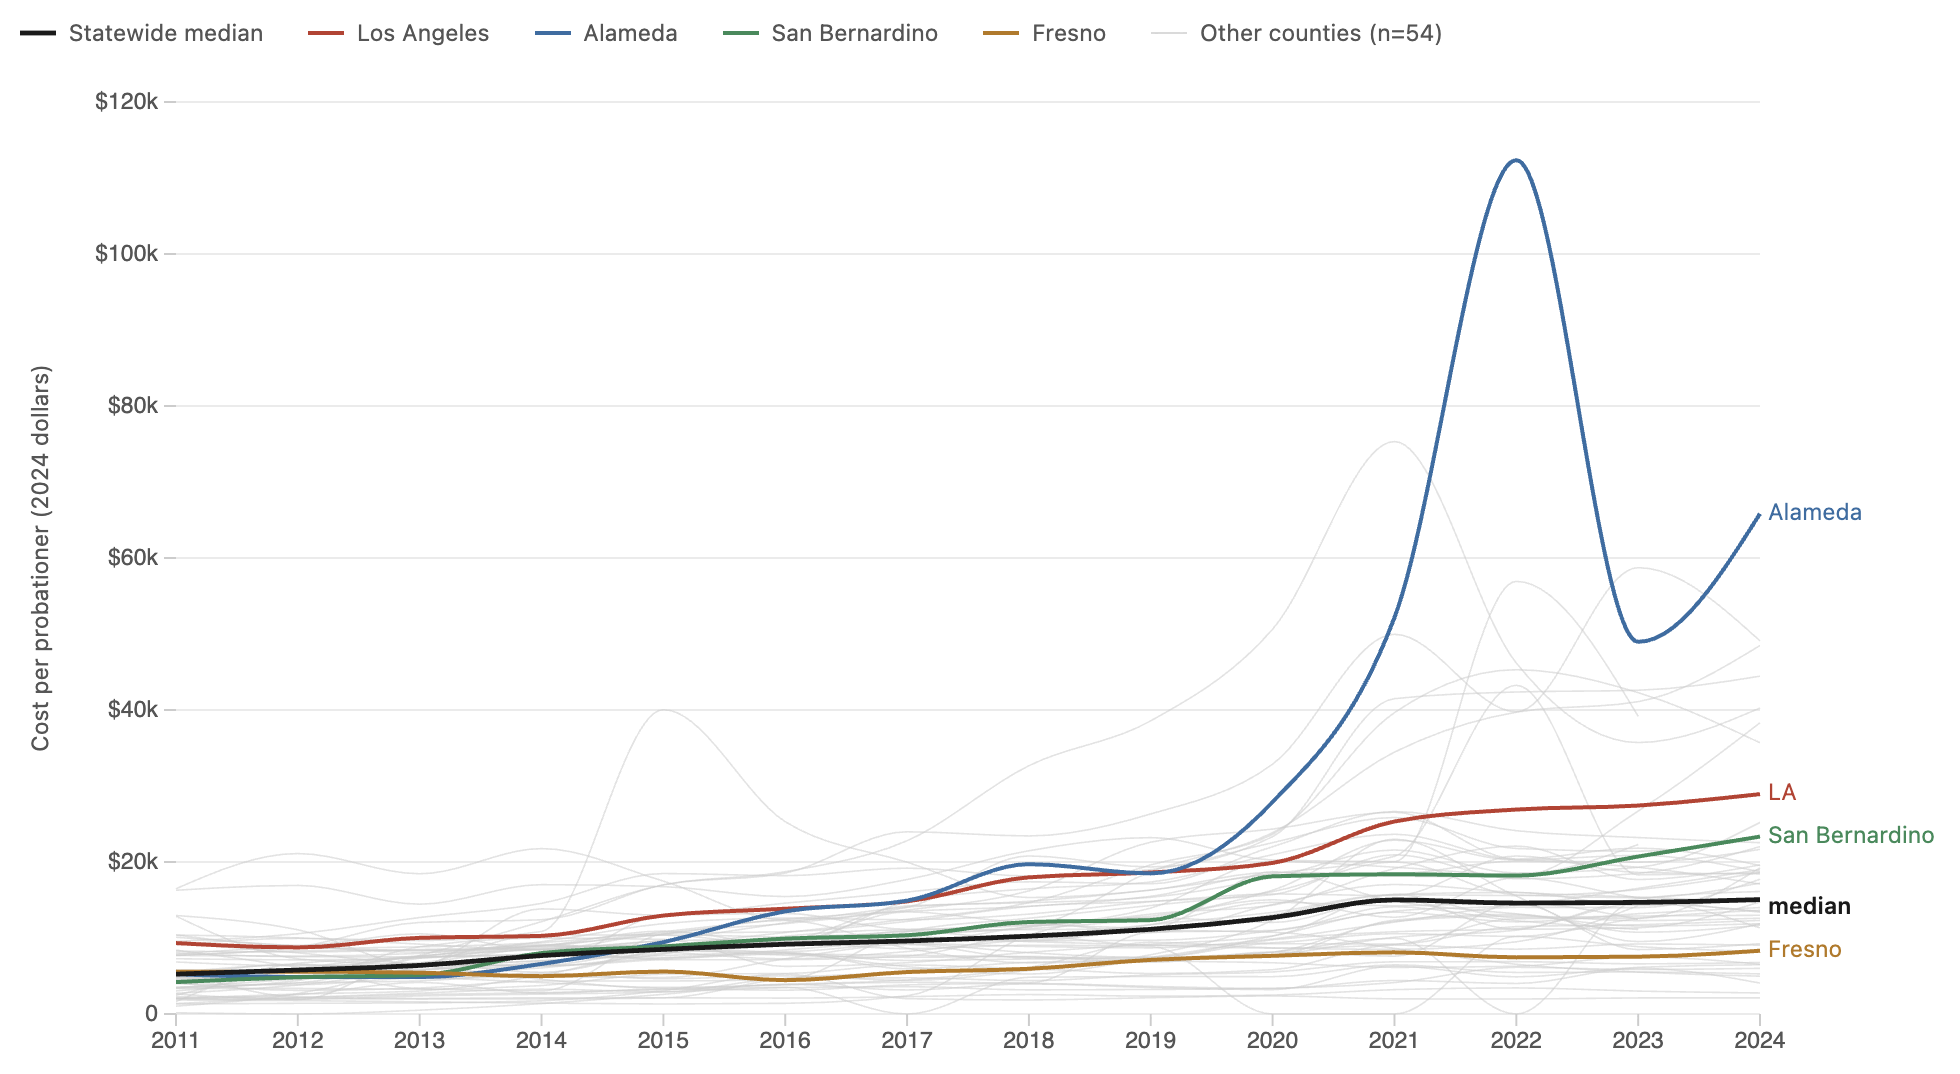
Figure 5. California county probation cost per probationer per county, 2011–2024, in 2024 dollars.
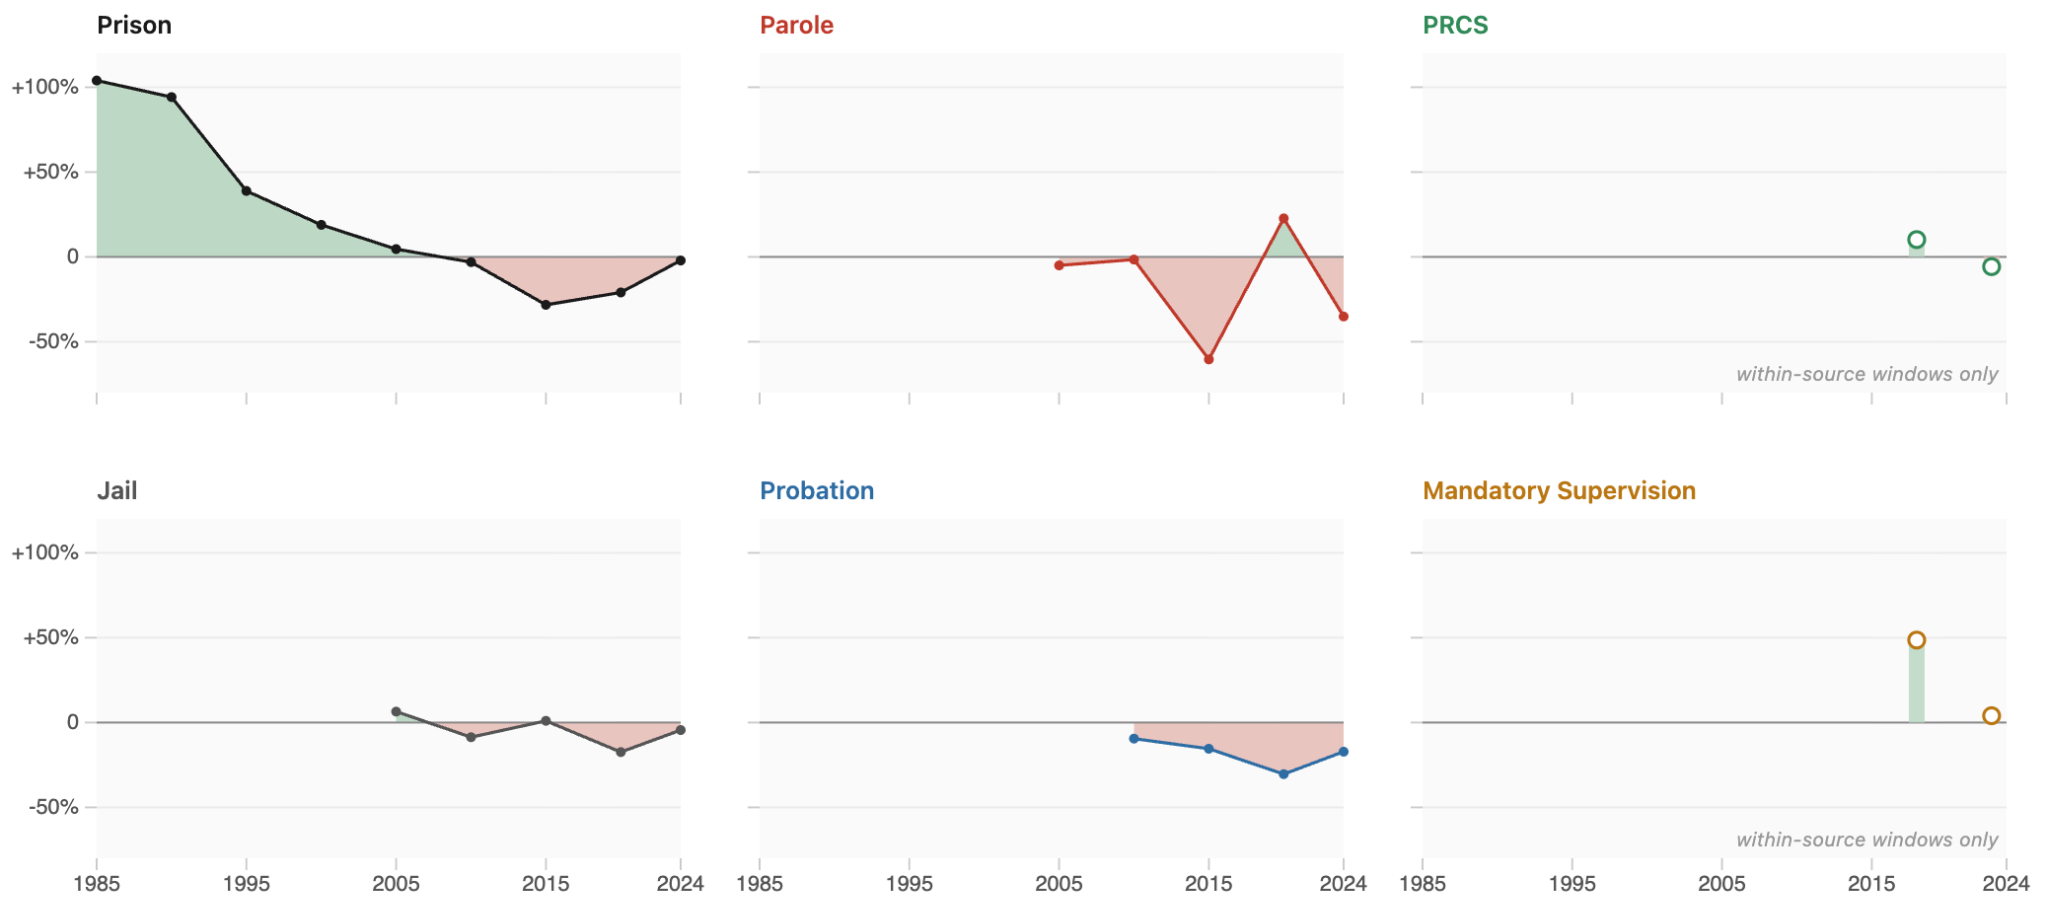
Figure 6. Rate of change of California justice-involved populations per program, every five years, 1980–2024. State prison nearly tripled in the 1980s under determinate sentencing, then fell in every five-year window since 2010. Parole dropped −60% in 2010–2015 after AB 109, and county probation has fallen every period since 2005. Jail and the post-realignment programs (PRCS, mandatory supervision) have shifted only modestly.
Appendix B: Neighborhood Heat and Justice System Co-occurrence
Map 1 in the Background identifies California census tracts where high justice system inequity and high heat social vulnerability co-occur as statistically significant spatial clusters. Further analysis and documentation is published in an online storymap (Becica, 2026d). This appendix describes the methodology, data sources, and disparity indicators used in Map 1 and the accompanying statistics.
Input indices. Two tract-level indices are used in the bivariate and statistical analysis, each normalized to a 0–1 scale:
- The Justice Equity Need Index (JENI) is a statewide adaptation of Los Angeles County’s Justice Equity Need Index (Advancement Project California, 2022), rebuilt at the California census tract scale. It is composed of three equal-weighted components: System Involvement (tract-level incarceration rates from the Prison Policy Initiative, 2020), Inequity Drivers (race/ethnicity, poverty, unemployment, and educational attainment from ACS 2019–2023; pollution burden from CalEnviroScreen 5.0; social isolation from LCI’s Vulnerable Communities Platform), and Criminalization Risk (mental health distress, binge drinking, and housing insecurity prevalence from CDC PLACES 2025).
- The Heat Social Vulnerability Index (SVHI) is from LCI’s Vulnerable Communities Platform (VCP) tract dataset (LCI, 2025a). It measures social vulnerability to heat through indicators of basic needs (food, housing, and transportation insecurity), income, disability, limited English proficiency, children under five, seniors living alone, mobile home prevalence, internet access, and health risk factors (asthma, COPD, diabetes, coronary heart disease, obesity).
Spatial methodology. For each index a local Getis-Ord Gi* hotspot analysis is computed at the tract level to identify where tract neighbors form a cluster of high (or low) values relative to the statewide distribution; neighbors are defined by a k-nearest-neighbors graph with k=8 (Ord & Getis, 1995; Anselin, 1995). Significance is assessed by conditional permutation, and a Benjamini-Hochberg false discovery rate correction is applied at q=0.05 (Benjamini & Hochberg, 1995). A tract is classified as “double-burden” if it is a statistically significant high-cluster on both JENI and SVHI independently. Urban double-burden tracts are grouped into spatial clusters using queen contiguity (two tracts join the same cluster if their polygons share an edge or corner), and clusters are ranked by total population.
Disparity indicators. Population-weighted means are computed for each cluster across demographic, justice, housing, isolation, and heat indicators at the tract level, then compared to statewide values. Sources include ACS 2019–2023 (race/ethnicity), Prison Policy Initiative (incarceration rates), CDC PLACES 2025 (housing insecurity), VCP (social isolation), CalEPA/OEHHA (urban heat island), and Cal-Adapt (projected heat days).
Appendix C: Climate Resilience and Community-Based Diversion Grants
Table 4. Allocations to state programs that may address the intersection of climate and decarceration, and the data sources used for analysis.
Climate resilience infrastructure grants
| Program (agency) | Stated primary goal | Total distributions | Definition of funding targets | Awardee data source |
|---|---|---|---|---|
| AHSC (SGC via HCD) | Reduce GHG emissions through land use, housing, transportation, and agricultural land preservation that supports infill and compact development, while increasing access to affordable housing, jobs, and destinations via low-carbon transportation. | $4.8 billion (2014–2025) | ≥50% of expenditures must benefit Disadvantaged Communities (DACs); ≥50% of funds for affordable housing; project-area targets of 35% TOD, 35% Integrated Connectivity Projects, 10% Rural Innovation Project Areas. | AHSC Program Dashboard (SGC, 2025b) |
| TCC (SGC) | Reduce GHG emissions and provide health, economic, and environmental benefits by empowering “the communities most impacted by pollution” via large-scale, multi-project neighborhood transformations. | $364 million (2018–2023) | 100% of implementation projects must benefit priority populations; ≥51% of project area in a DAC census tract or Tribe. | TCC Program Awards (SGC, 2024) |
| CRC (SGC) | Fund neighborhood-level centers that provide shelter and resources during climate emergencies and offer year-round community services. | $153 million (2023) | Centers must serve residents most burdened by environmental and socioeconomic inequities, per the CRC Vulnerability Framework. | CRC Report to the Legislature (SGC, 2025a); California Grants Portal (CSL, 2026) |
| CalEPA EJ Small & Action Grants | “Lift the burden of pollution” from those most vulnerable by supporting communities to implement local solutions. | $8.25 million (2024–2025) | Projects must serve communities with the “most significant exposure to pollution,” measured by DAC census tract. | EJ Grants Round 1 Awardees (CalEPA, 2024); 2025 EJ Action Grant Recipients (CalEPA, 2025) |
| EHCRP (Governor’s Office of Land Use and Climate Innovation) | Fund heat action plans and cooling solutions for low-income urban areas that “disproportionately feel the impacts of extreme heat.” | $69 million (2025) | Infrastructure must be located within areas designated as Priority Populations in the California Climate Investments Priority Populations Mapping Tool 4.0. | EHCRP Round 1 Awards List (LCI, 2025b) |
Social and health service program grants to prevent justice system involvement
| Program (agency) | Stated primary goal | Total distributions | Definition of funding targets | Awardee data source |
|---|---|---|---|---|
| CalVIP (BSCC) | Reduce community gun violence through non-carceral methods. | $246 million (2019–2024) | ≥50% of any public-agency award must pass through to CBOs; projects focus on communities with high rates of homicides, shootings, and aggravated assaults. | Not coded; CalVIP Project Summaries (BSCC, 2024) |
| Safe Neighborhoods and Schools Act (Prop 47) Grants (BSCC) | Invest state savings from reduced incarceration into recidivism-reduction programs (mental health, substance use treatment, diversion). | $490 million (2014–2024) | ≥50% of any public-agency award must pass through to CBOs; target populations have a history of mental health or substance use disorders and criminal justice involvement. | Not coded; Prop 47 Grant Reports (BSCC, 2025) |
Awardee characterization criteria. Award data for the five climate resilience programs were collected from publicly available grant awardee lists, program dashboards, and published reports between January and March 2026 (see Table 4 for data sources by program). AHSC Rounds 1–5 were sourced from the SGC dashboard (SGC, 2025b), which provides less detailed project descriptions than the California Grants Portal used for Rounds 6–9 (CSL, 2026). CalVIP and SNSA/Prop 47 awards are included for context; they were reviewed but not coded at the project level as they do not fund physical infrastructure.
Each of the 373 climate program awards was coded by reviewing individual project descriptions. Each awardee was characterized by grantee lead type (Public, CBO, Tribal) and project phase (Planning, Project Development, or Implementation). Lead type denotes a non-public-agency lead, but what this classification captures in practice differs across programs: in AHSC, CBO leads are operationally affordable housing developers; in CRC, the collaborative governance structure creates space for grassroots CBOs in decision-making roles; in CalEPA Action Grants, 501(c)(3) status is required and public agencies are excluded. Each award was then coded across the intervention-topic variables in Table 5.
Table 5. Intervention-type coding criteria for state grant awardees
| Variable | Coded “yes” when the project description includes: |
|---|---|
| Urban greening | Tree canopy, cool pavement, shade structures, green infrastructure |
| Food systems and urban agriculture | Community gardens, food production, distribution networks, food sovereignty programming |
| Clean energy and resilient power | Solar, battery storage, microgrids, HVAC, electrification |
| Housing and shelter | Affordable housing, emergency shelter, unhoused services |
| Community safety and restorative justice | Restorative justice, violence prevention, reentry, decarceration, diversion |
| Tribal cultural stewardship | Cultural preservation, traditional ecological knowledge, indigenous land management |
| Health services and healing | Health clinics, mental health, healing justice, public health programming |
| Transit | Transit infrastructure, active transportation, transit-oriented development |
| Extreme heat mitigation | Any intervention addressing extreme heat, including cooling or cooling centers, energy during power shutoffs, and programming during heat waves |
A project was marked as including a resilience hub if a facility funded within it met a two-part definition: (1) coordinates resource distribution and services before, during, or after a natural hazard event, and (2) functions year-round to support the community through ongoing programming, services, and relationship-building. If a facility met only the second criterion, it was classified as a community center. For the 54 projects that met the resilience hub definition, the hub site was identified through the awardee’s project description or the organization’s website. The full awardee dataset is published in Becica (2026a).
Scope and limitations. The list of resilience hub projects and their addresses is not exhaustive and should be considered illustrative of where and how these specific state grants are distributed. Other state funding sources for resilience hubs were noted but not used as primary sources (e.g., California Department of Food and Agriculture, the Coastal Conservancy, CalEPA Tribal Affairs, the California Tribal Fund). A few resilience hubs funded outside state funding were not included, such as Richmond’s RYSE, which was funded with federal grants.
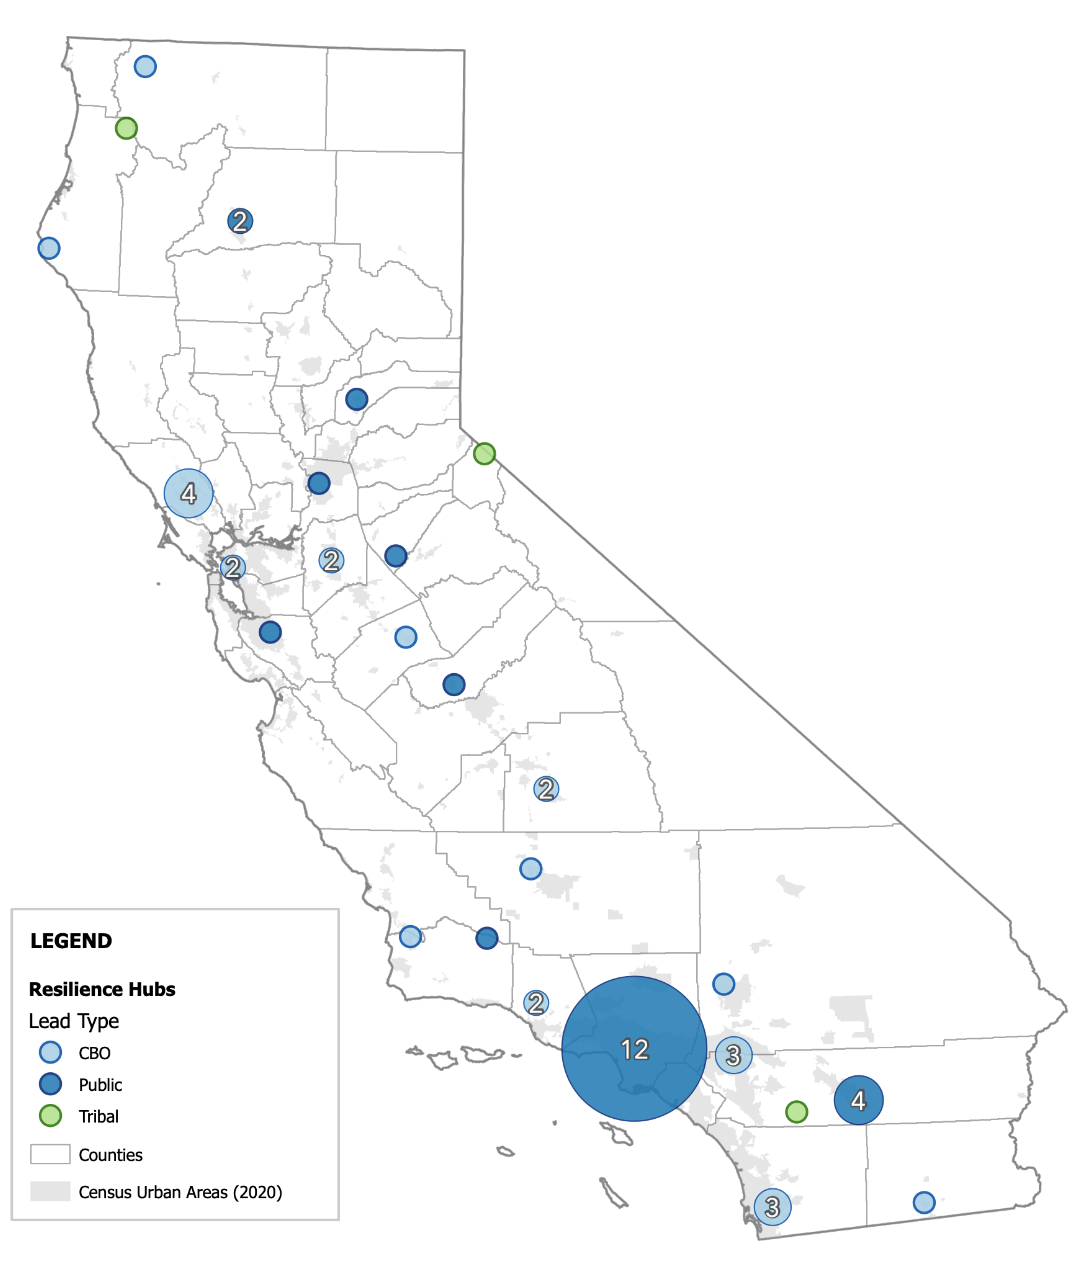
Map 4. Between 2015 and 2025, four California state grant programs funded approximately 54 resilience hubs throughout the state. Of these, 49.1% of awardees were led by a community benefit organization or non-profit, 38.2% by a public agency, and 12.7% by a Tribal organization.
Appendix D: Heat Risk Index Methodology
The Prison Heat Risk Index uses an additive risk framework where risk is the weighted sum of three normalized component scores for Hazard, Exposure, and Vulnerability (0.25H + 0.25E + 0.50V), following recommendations from Ovienmhada et al. (2024). Vulnerability is double-weighted to prioritize latent medical risk. The additive form prevents a facility with full mechanical AC from scoring zero risk; the index can then answer “where are people most at risk if cooling fails?”, taking into account that cooling in prisons may be withheld or neglected due to power imbalances between staff and incarcerated people (Brunn et al., 2025). The Hazard, Exposure, and Vulnerability components are each an equal-weight composite of sub-indicators normalized 0–1 across 31 facilities; the final score is normalized 0–100 jointly across both time periods (Figure 7).
Hazard combines annual days over 90°F, frequency of hot nights, and air quality. Exposure combines the ratio of indoor to outdoor 78°F days, urban heat island effects, and refrigerated air conditioning rates. Vulnerability combines CCHCS health risk tiers, share of the population 50+, share enrolled in the Enhanced Outpatient Program for mental health (EOP), share with a Disability Placement Program designation (DPP), and share of people of color at each facility. Full documentation and all facility-level data have been published as an open dataset (Becica, 2026b).
Adaptive capacity is not included as a fourth component, following Ovienmhada et al. (2024)’s treatment of incarcerated populations as having effectively zero adaptive capacity. Incarcerated people cannot relocate, purchase cooling, choose their housing unit, or leave during a heat event; the structure of incarceration removes the individual and collective agency that capacity metrics are designed to measure.
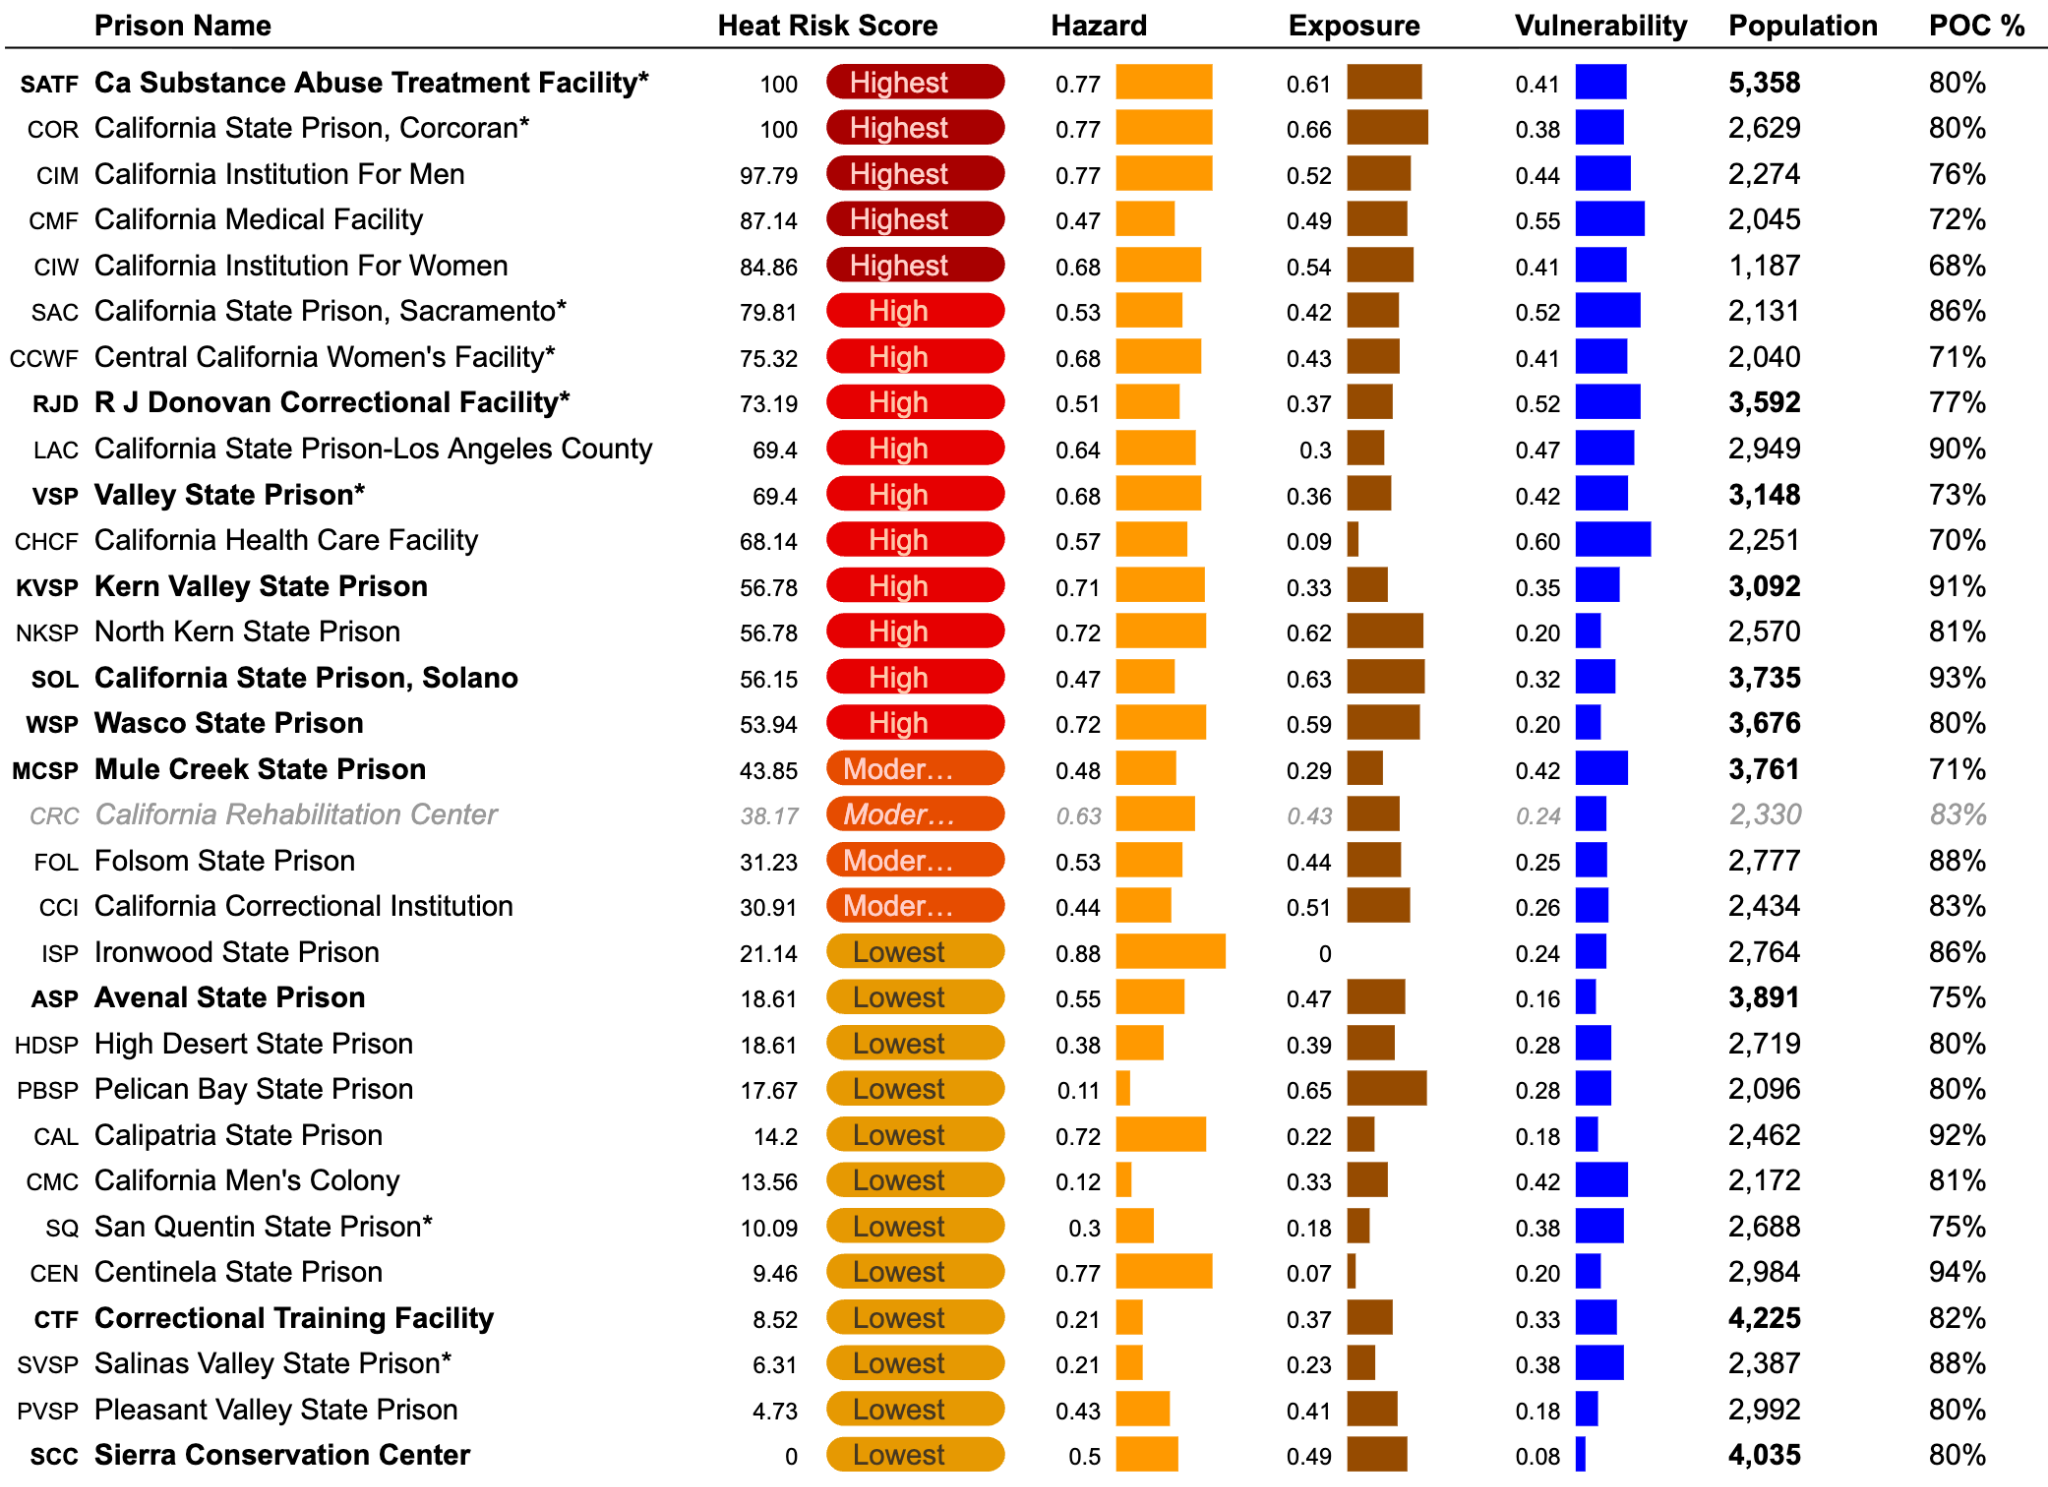
Figure 7. Projected relative heat risk of CDCR prisons by mid-century (2041–2070), with the 10 most populous facilities highlighted. The index shows relative risk, not absolute; individuals in the “Lowest” risk facilities still experience negative effects of heatwaves. POC % is the percentage of incarcerated people who are non-white (2025). Source: Author’s composite index.
Appendix E: Incarceration-Years Cost Model
Methods. To estimate heat-related illness and death impact, the marginal acute mortality (M_acute) is calculated by applying Skarha’s (2023) all-cause mortality slope to projected threshold exceedance person-days:
where P_exp is hazard (facility population × average annual days with tmax ≥ mean summer tmax + 10°F, 1991–2020 WMO baseline), T_excess accounts for the continuous dose-response (mean excess of 3.11°F above threshold → 1.31×), μ is the baseline annual all-cause mortality rate, and Δ is the 5.2% mortality increase per threshold exceedance day (Skarha, 2023).
To estimate the marginal increase in time served (Y_total) due to extreme heat exposure, time lost from non-violent behaviors (infractions) is summed with time lost from violent incidents (credit forfeiture and recommitment from victimization):
where λ_nv and λ_v are vulnerability to the rate of non-violent and violent infractions, Δ_v is the hazard exposure effect on violence, ρ_recidivism is the risk rate of recidivism from victimization, and t is time lost in years (for non-violent infractions, violent infractions, and new sentence length for recommitment).
Detailed model findings. Given an exposure rate of three months per year to 90°F days by mid-century (2040–2070), 75% of the incarcerated population is modeled as exposed based on facility location. When estimates from known findings about California’s incarcerated population are applied, 25% are not impacted by the temperatures, 24.6% are estimated to be of highest heat vulnerability to illness and death, and between 8.6–28.6% are estimated to be involved in heat-related violations.
The marginal increase to mortality was calculated using Skarha’s (2023) finding that each day exceeding a facility’s mean summer maximum temperature by 10°F is associated with a 5.2% increase in all-cause mortality. Applied to 840,457 projected Skarha-threshold person-days across 31 CDCR facilities (2016–2025 average), using a baseline mortality rate of 3.07/1,000/year (CCHCS 2016–2019) and a slope adjustment of 1.31×, this yields approximately 0.48 heat-attributable deaths per year currently — one heat-attributable death every ~2 years system-wide. By mid-century there will be approximately 1,256,069 person-days above Skarha’s threshold, increasing heat-attributable deaths ~50% to 0.72 per year, or one every 1.4 years.
The marginal increase to incarcerated person-years was summed from the effects of non-violent and violent violations. A 20% marginal increase applied to the baseline of 9,944 violent incidents per year among the exposed population (CDCR Performance Measures Incidents Reports, 2021–2024) yields 1,066 additional violent incidents annually (a 10.7% increase). Using a midpoint credit forfeiture of 210 days gives 613 total credit-years lost. To estimate additional recidivism from victimization, Listwan et al. (2013) report an odds ratio of 1.325 for recommitment among prison violence victims; applied to the system-wide three-year return-to-prison rate of 23.7% (CDCR Recidivism Reports, 2013–2018), this yields a marginal increase of ~5.5 percentage points among victimized individuals, or ~59 additional recidivists per year. Using the average sentence length for parole violators returning with a new term (4.4 years), steady-state incarceration attributable to recidivism increases by 260 person-years annually. Non-violent infraction rates are unknown, so they are provided in a range of 0–20% with a midpoint of 15 days credit lost, giving a range of 0–382 credit-years lost.
Appendix F: Engineering Alternatives for Prison Urban Heat Island Effects
The provision of air conditioning (mechanical cooling) was shown to effectively eliminate heat-related mortality in Texas prisons, and much of CDCR’s proposed solutions have included mechanical cooling (Skarha et al., 2022; CDCR, 2025). 24% of CDCR housing units currently have mechanical cooling, 52% have evaporative cooling, and the remainder use air handlers or fans (CDCR, 2025; Raychaudhuri et al., 2025). However, as described by CDCR, the materials and age of the buildings often render cooling systems ineffective due to urban heat island effects.
Several decades of civil and environmental engineering research has established interventions to effectively reduce the effects of urban heat islands. Cool roof materials and colors reduce the indoor temperature under a roof by 50°F compared to traditional roofs (USDOE, 2024; Akbari, 2016). Replacing asphalt with cool pavement materials and colors can reduce the nearby surface temperature by 30°F (LBL, 2025; Akbari, 2016). While shade structures help reduce air temperatures, one of the most effective tools for reducing physiologically equivalent temperature in an urban heat island is tree shade; trees can reduce temperatures by up to 35°F (Wu, 2025).
Recommendation: address heat island effects with lower-cost, short-term interventions. Waiting for complex HVAC overhauls is insufficient. CDCR should immediately incorporate lower-cost, research-backed interventions into existing maintenance cycles: ensuring all roof upgrades use “cool roof” materials per California Energy Code Title 24 (Akbari, 2016; CEC, 2022), replacing asphalt with permeable pavements, and increasing tree canopy wherever possible. These measures reduce urban heat island effects and improve the efficiency of future mechanical cooling systems.
Appendix G: Heat-related Legal Costs for CDCR
Between 2022 and 2026, CDCR-related class action and settlement costs ran about $181.2 million. The bulk of that, $155 million, came from Coleman v. Newsom fines over inadequate mental health care (LAO, 2024). A shared $21.1 million attorney fee pool in FY 2022-23 covered Plata v. Newsom, Armstrong v. Newsom, Clark v. California, and Ashker v. Newsom (CDCR, 2024a), and a $5.1 million pregnancy discrimination settlement in Carreon v. CDCR (Civil Rights Litigation Clearinghouse, 2024). Factoring in $56.9 million in Ashker monitoring-phase fees through 2027 (CDCR, 2024a), the six-year total reaches roughly $238.1 million, averaging close to $39.7 million a year. In Stoetzl v. State, the 2024 Budget Act gave CDCR blanket augmentation authority to draw litigation defense costs from the General Fund with no ceiling (California State Assembly Committee on Budget, 2024); that case involves an ongoing wage/hour dispute covering around 40,000 employees. The 2026-27 budget also includes $23 million for ADA-compliant infrastructure tied to Armstrong v. Newsom (California DOF, 2025).